Data Visualization Portfolio
Regenerative Crime Report
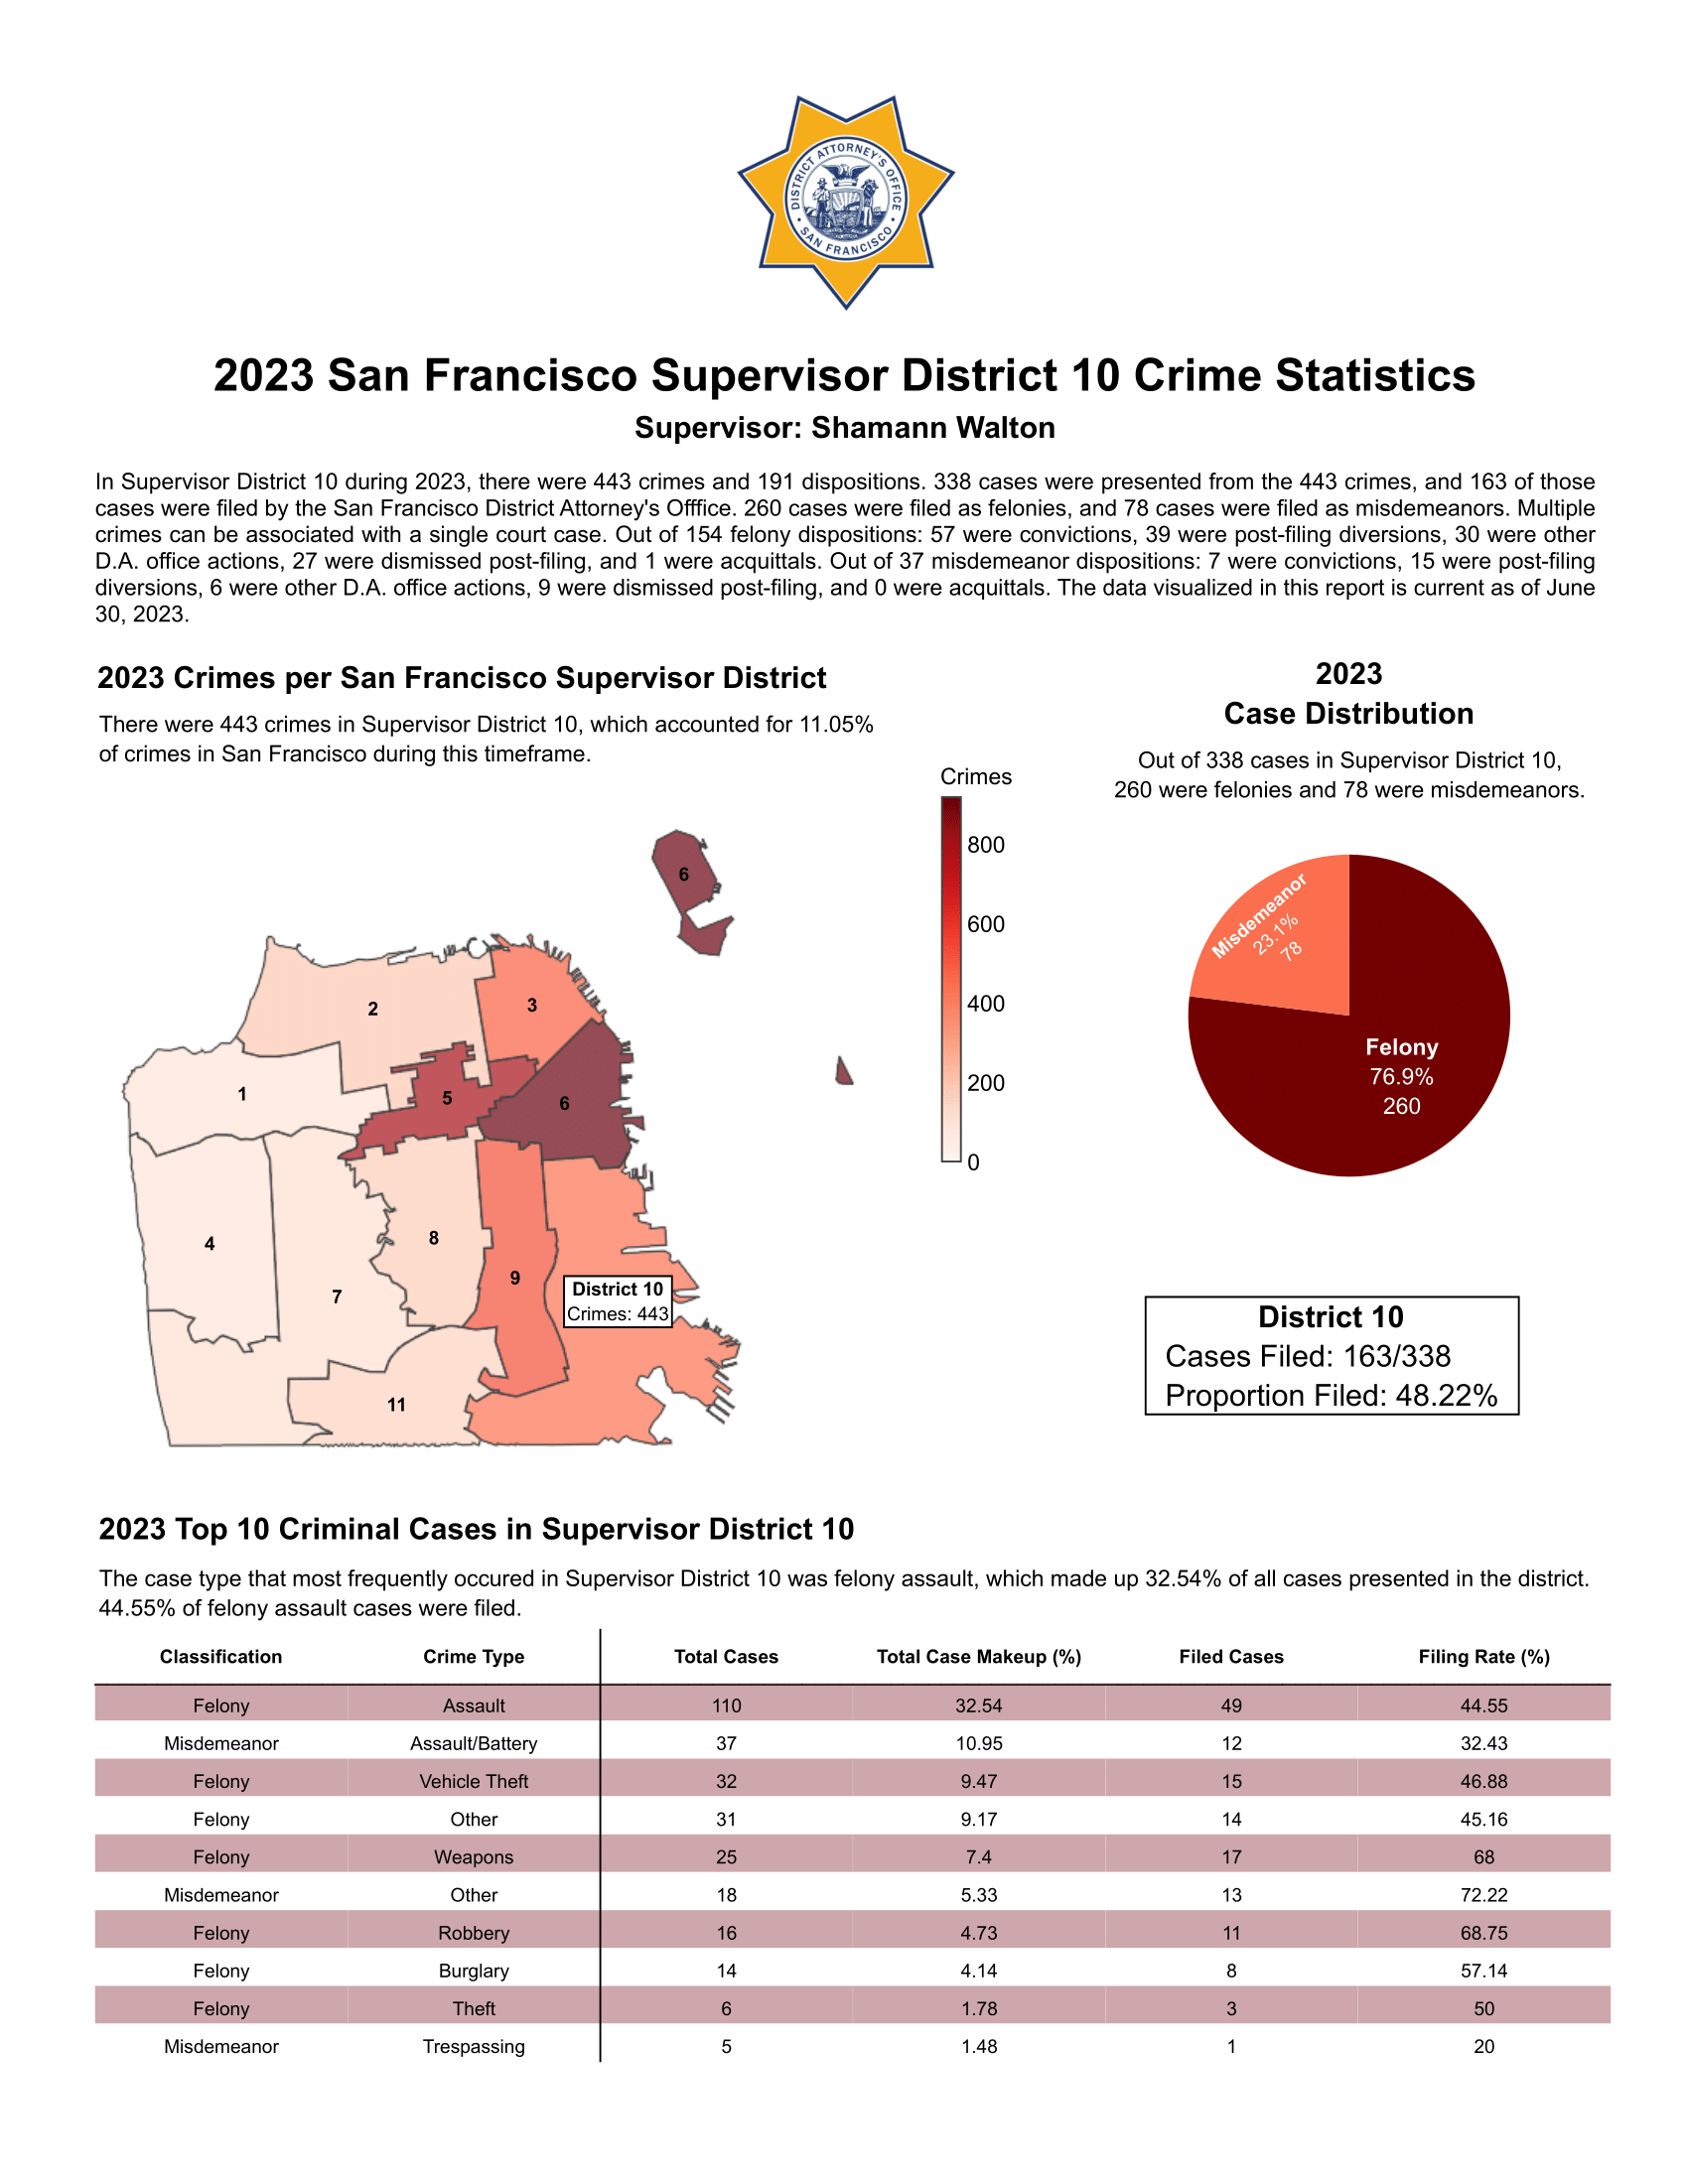
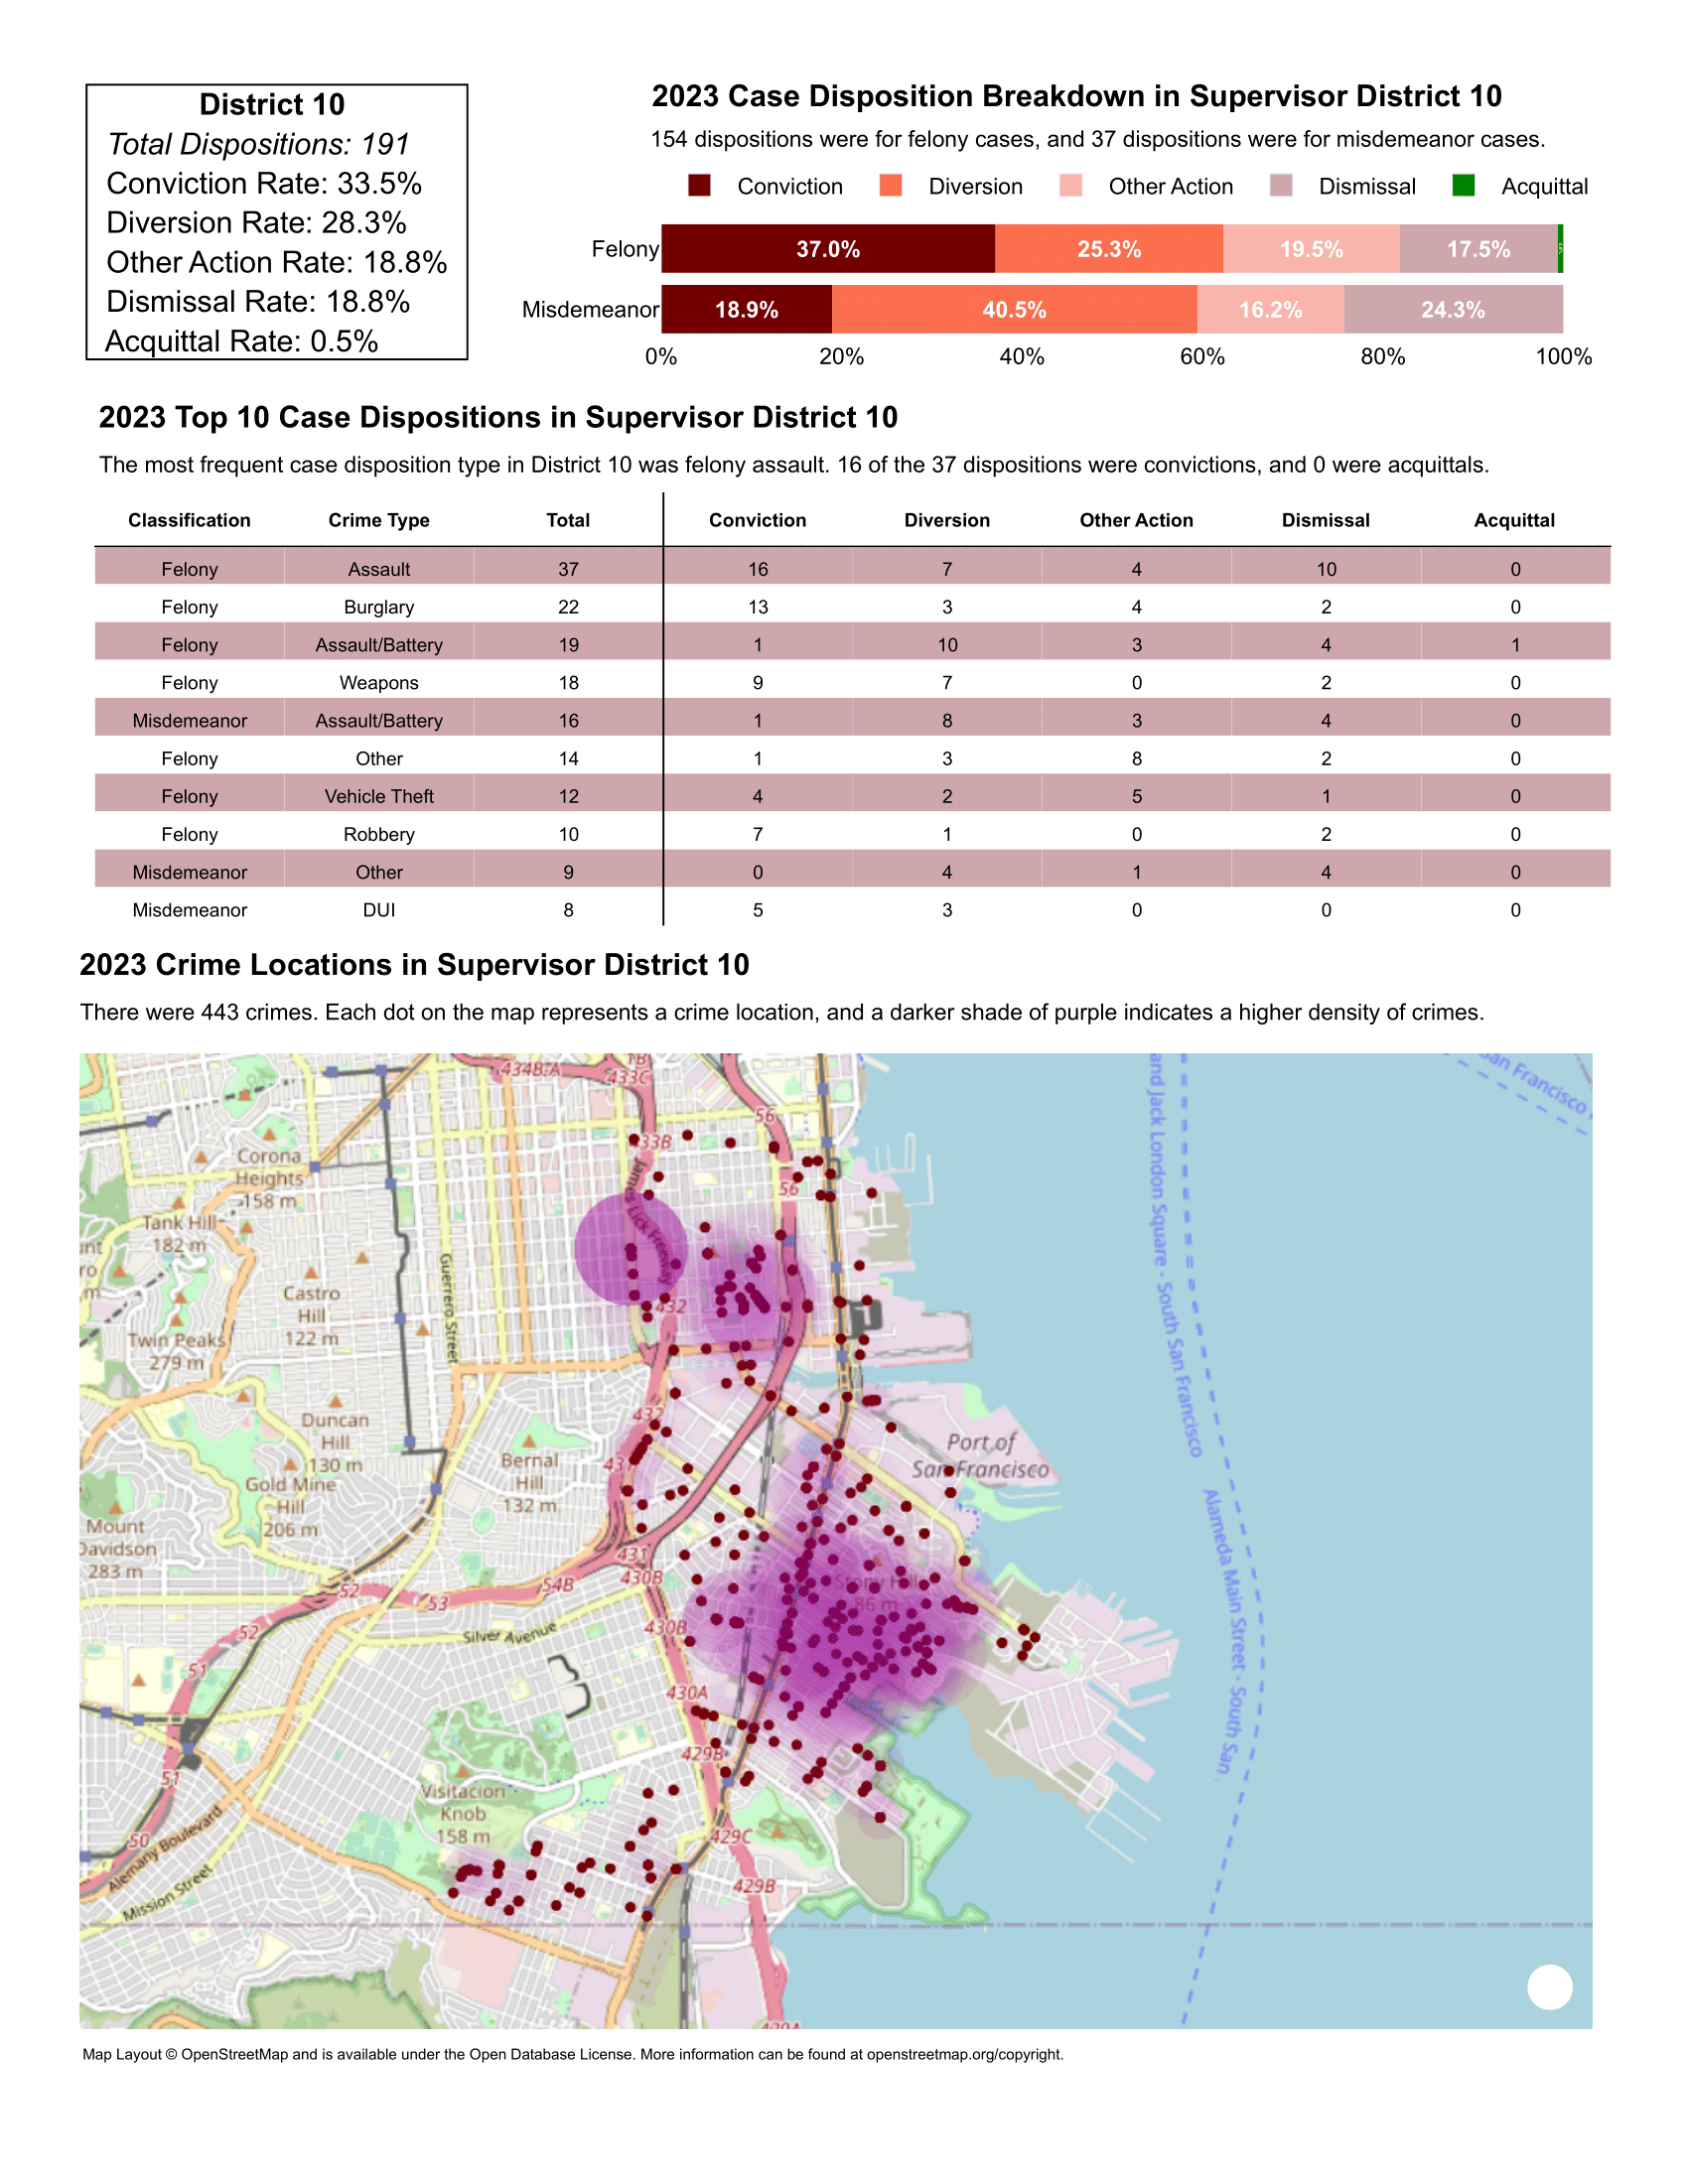
I created a regenerative temporal and geospatial data memo that details crime trends in San Francisco supervisor and police districts for distribution to community members across the city by the San Francisco District Attorney's Office. I analyzed several datasets of over 200000 county crime records and used HTML/CSS/JavaScript to design the report layout and theme, R to analyze the data, and Python Plotly to visualize the data.
Summer Crime Analysis
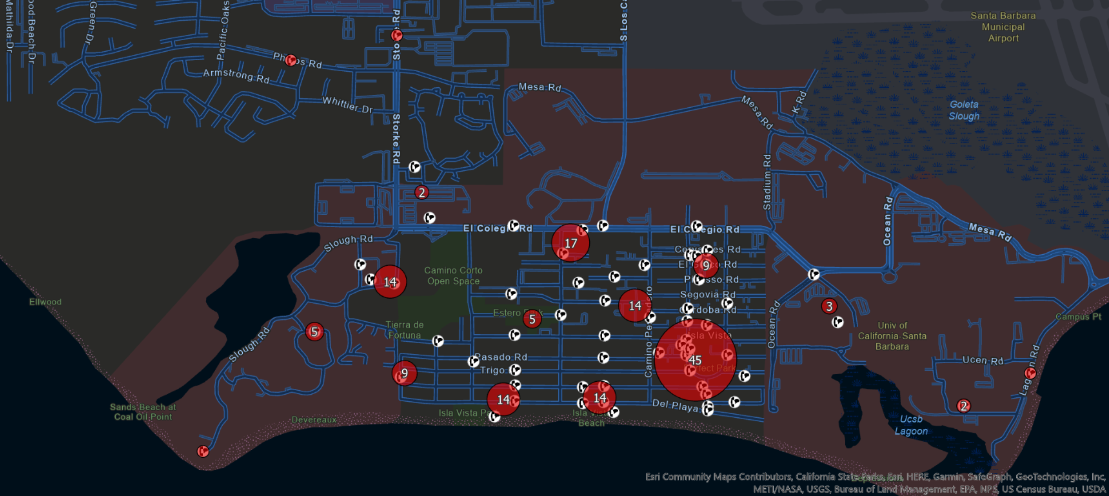
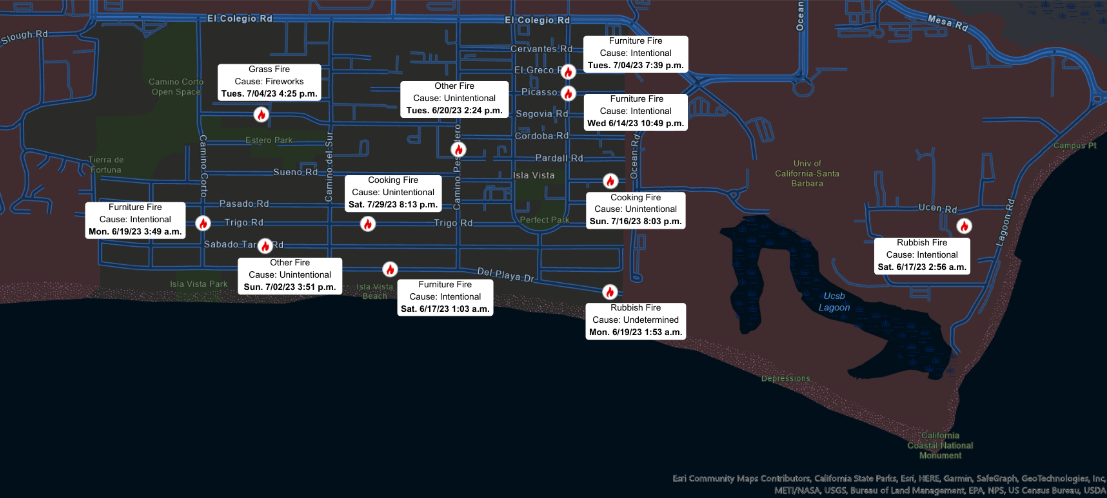
I analyzed crime data from the UC Santa Barbara Police Department crime logs using Python Pandas and created multiple visualizations and maps using ArcGis Pro.
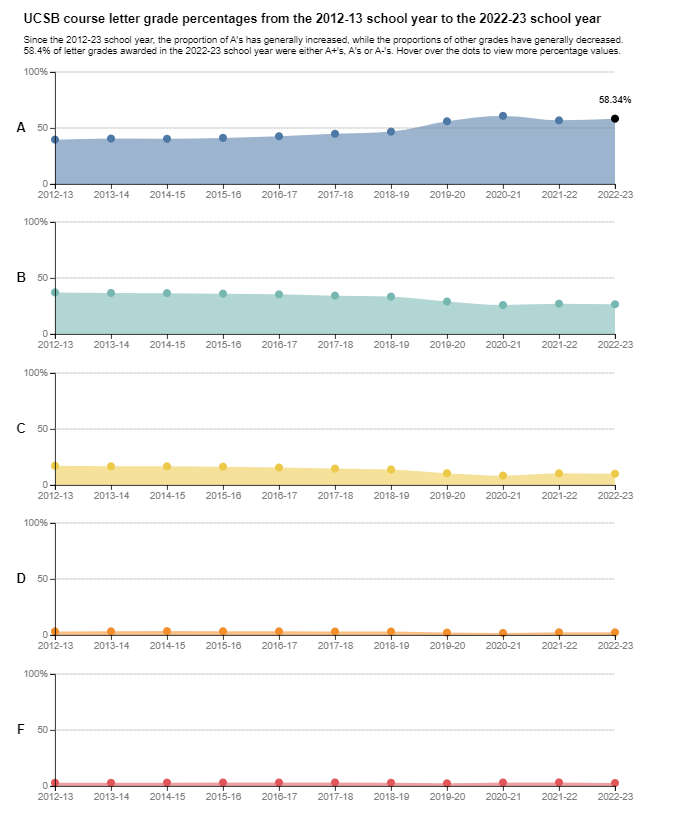
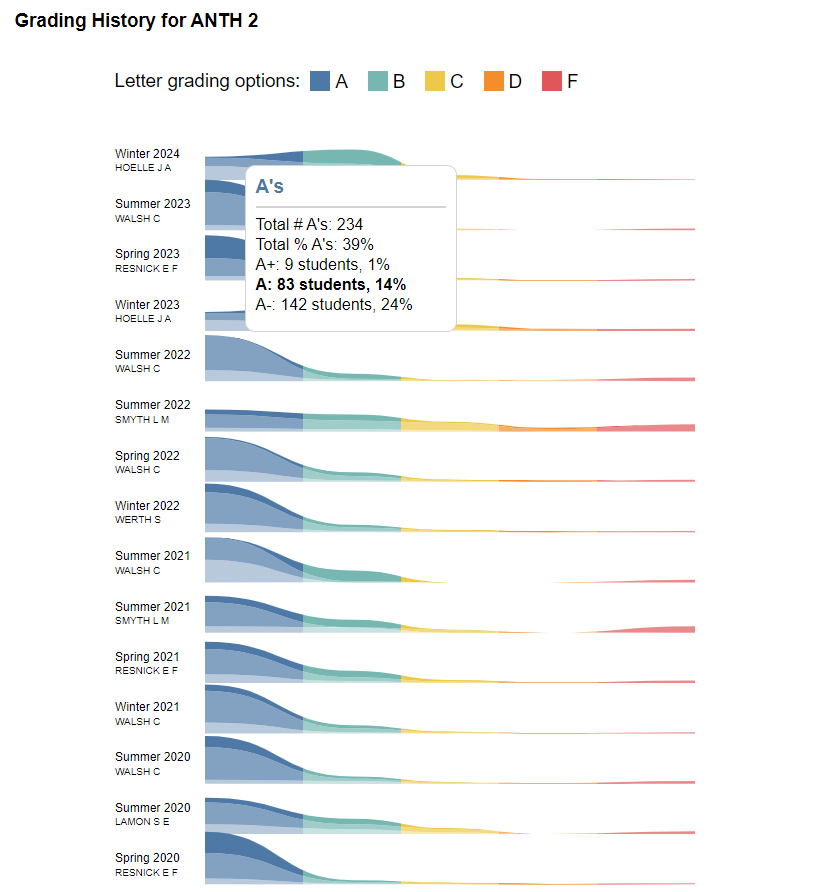
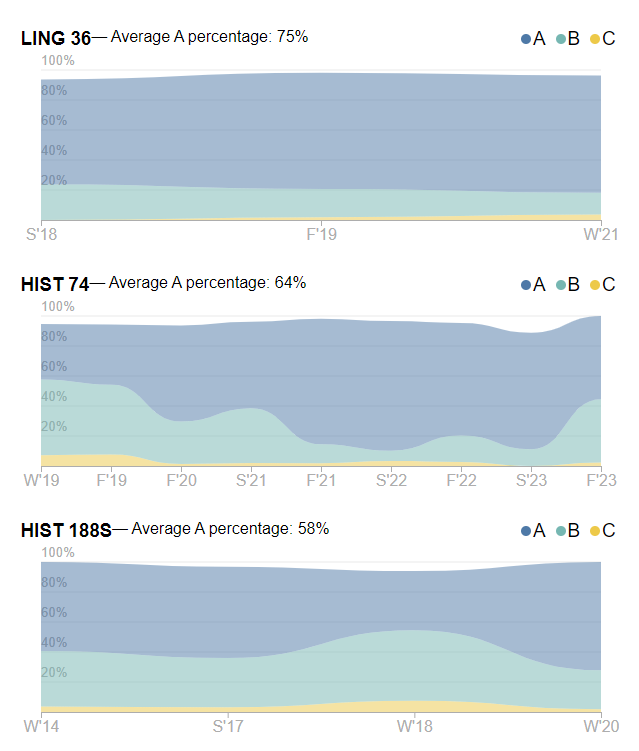
Daily Nexus Grades Website
I project managed the Daily Nexus Grades Website, which contains D3.js visualizations of UCSB course grade data by course, instructor, and the best general education courses from the last 15 years. I pull, clean, and analyze quaterly data from the UCSB Office of the Registrar, and I collaborate with the Social Media and Web Sections to market the site and publish the visualizations. I have also written an article analyzing the 2022-23 UCSB grade distributions within the context of the past decade, and I created an interactive D3.js chart to visualize the data.
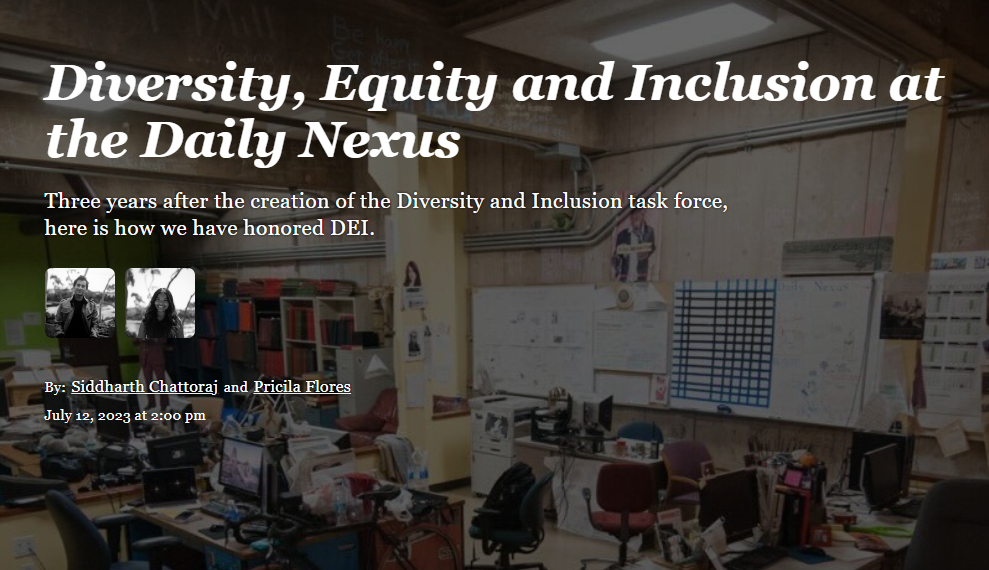
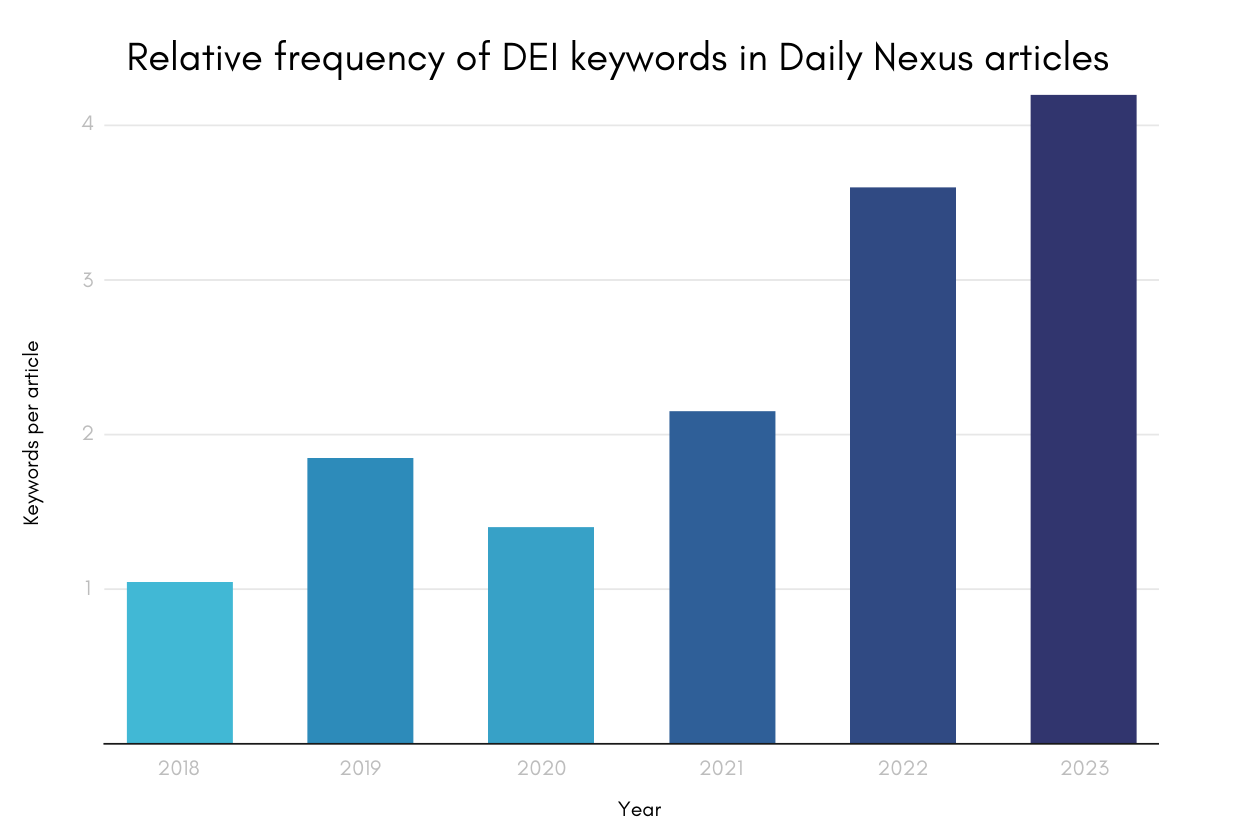
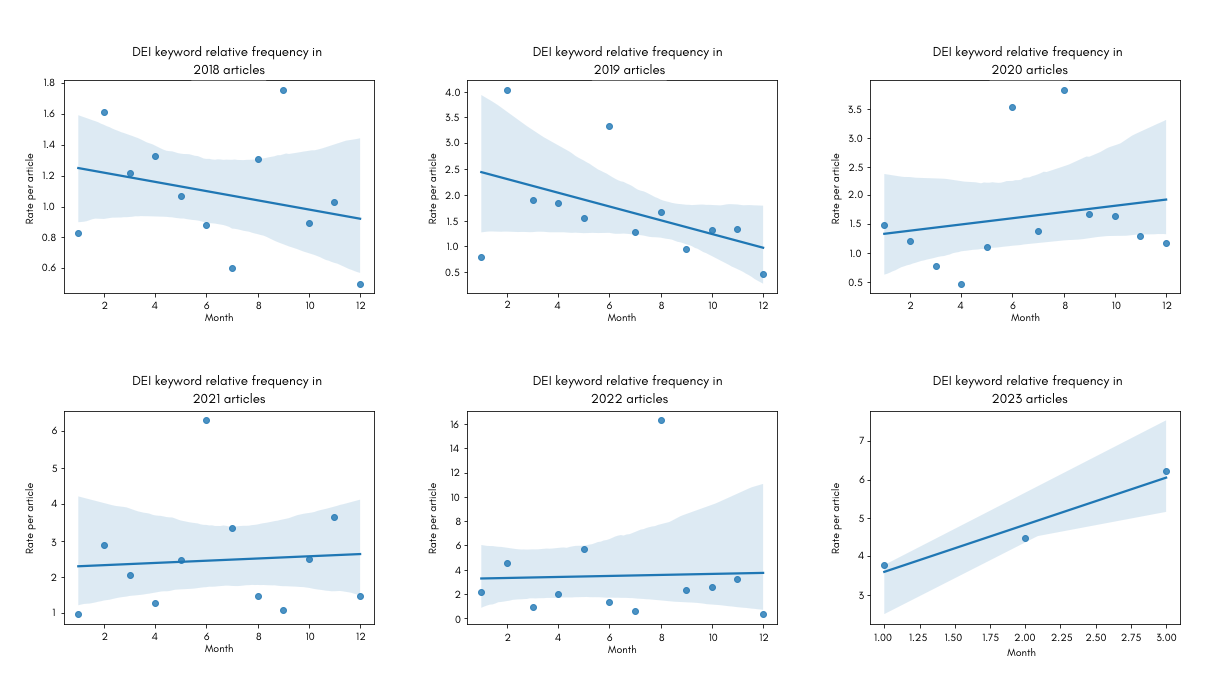
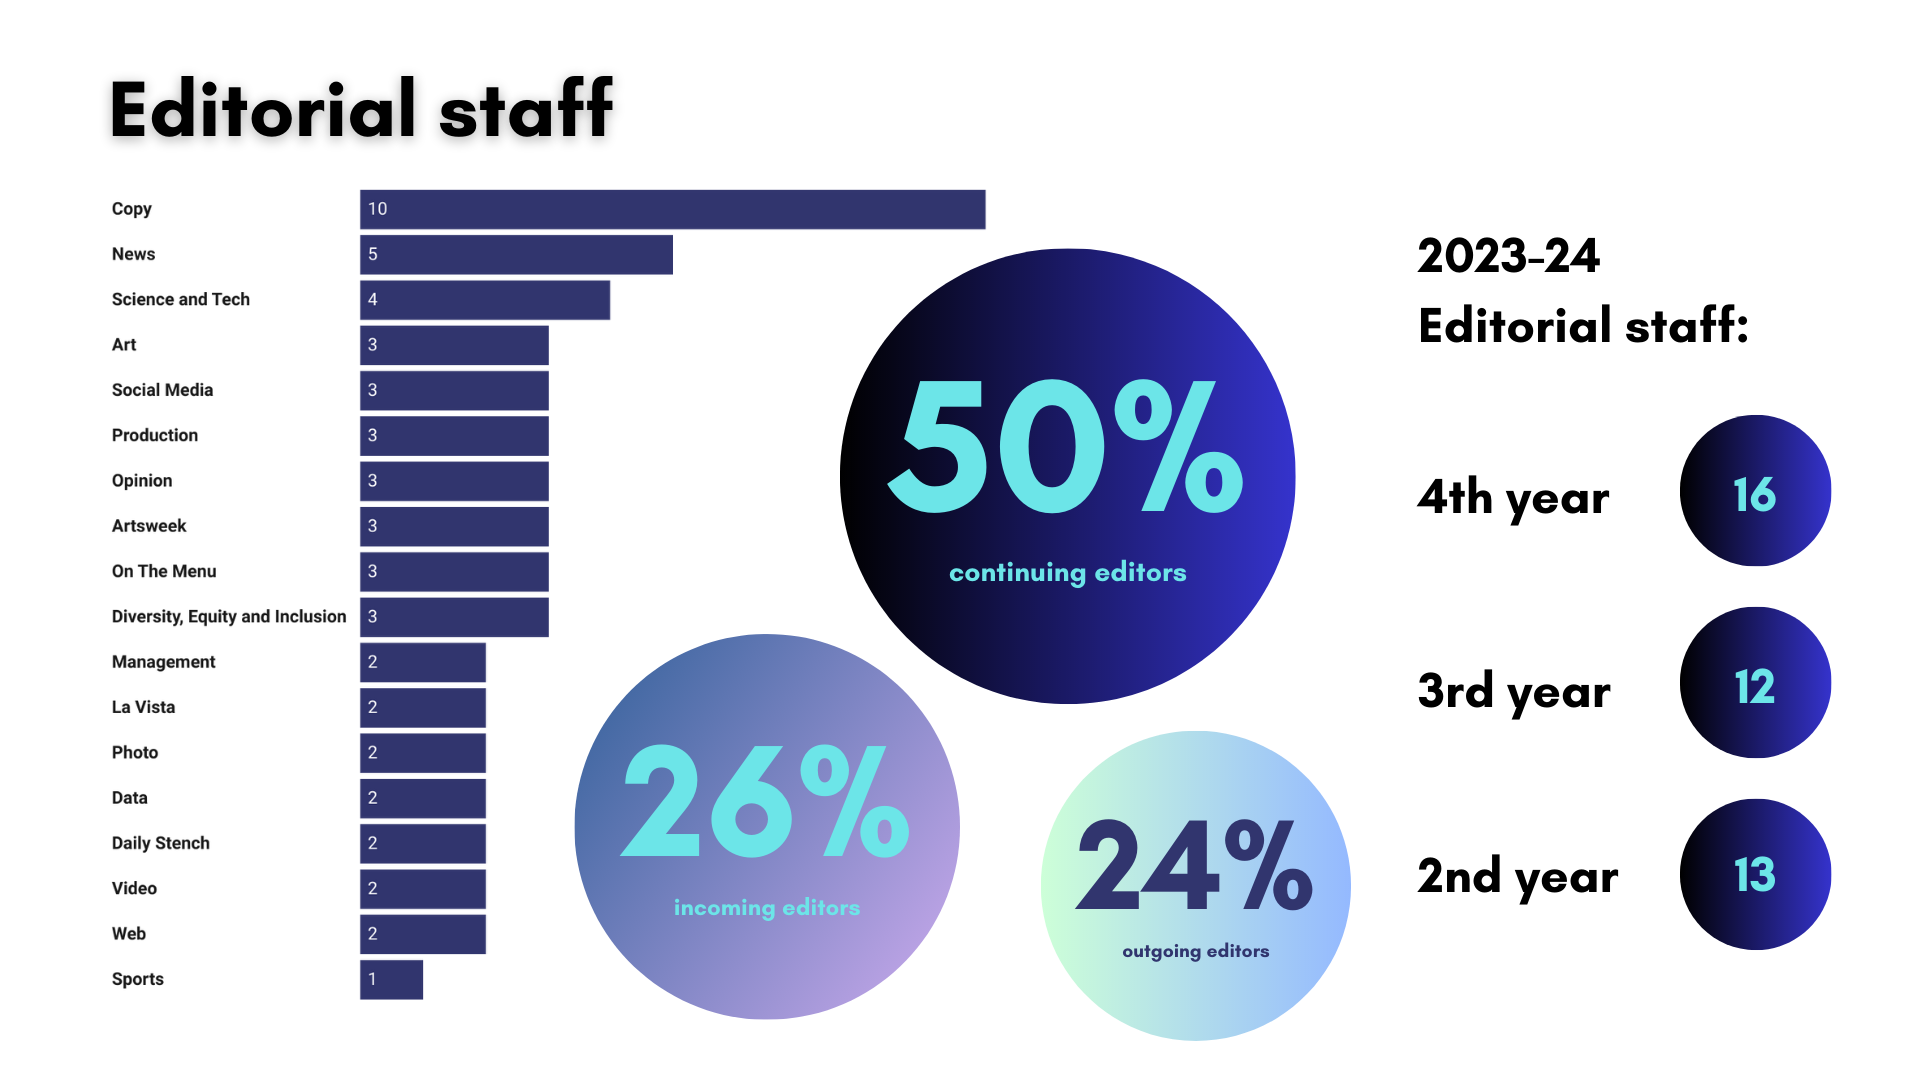
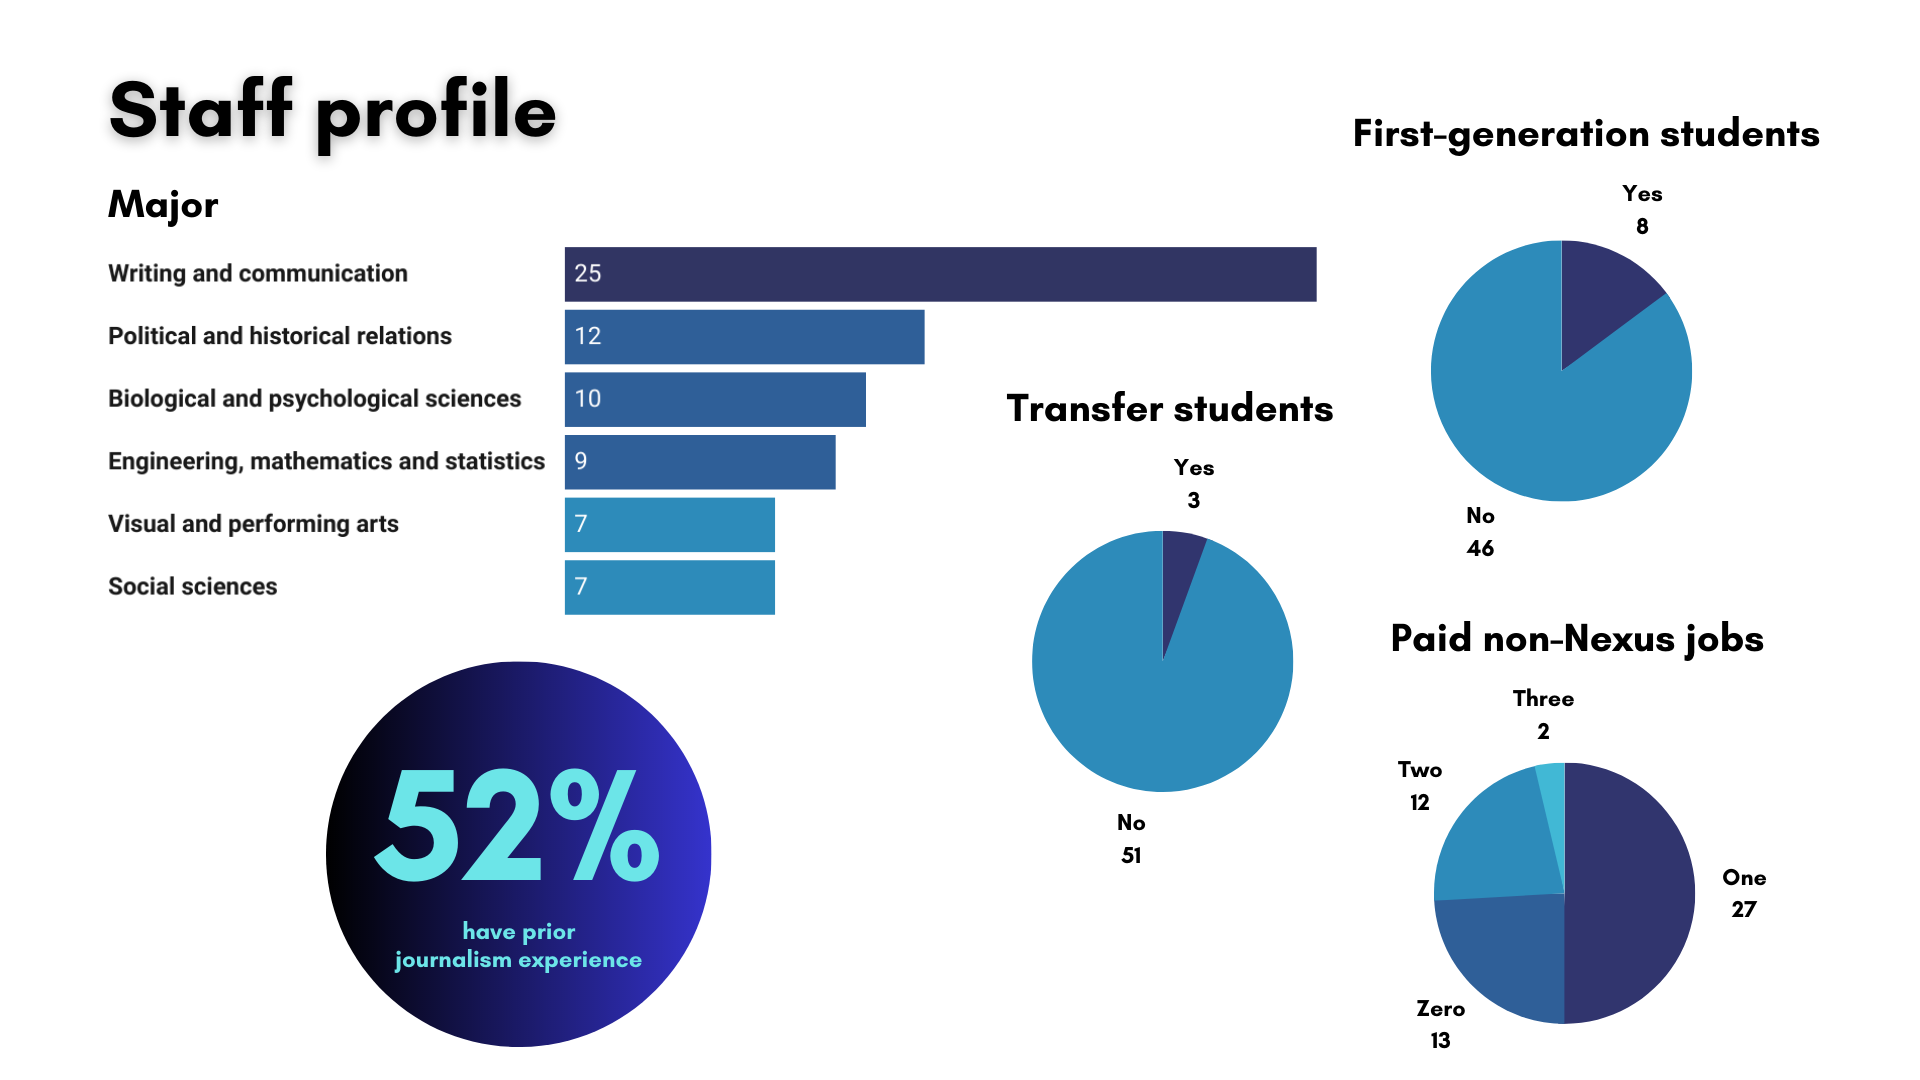
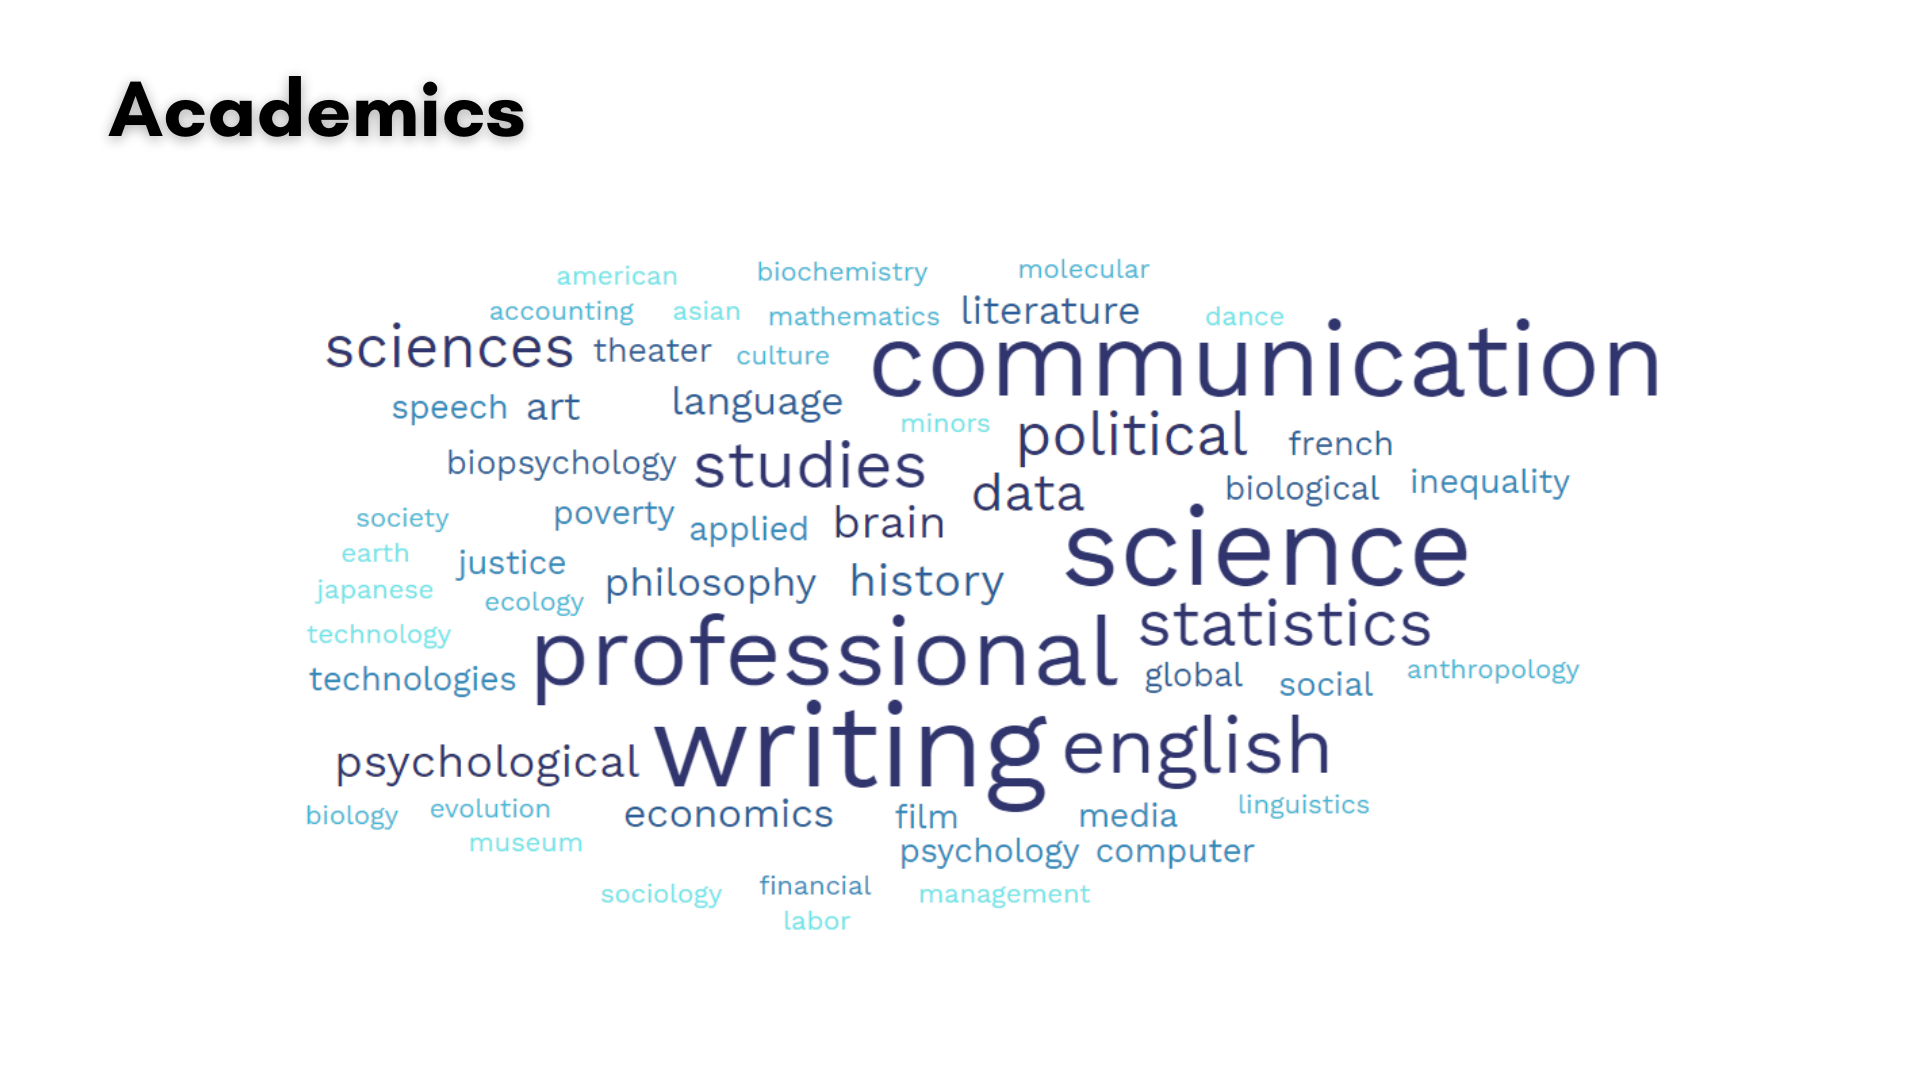
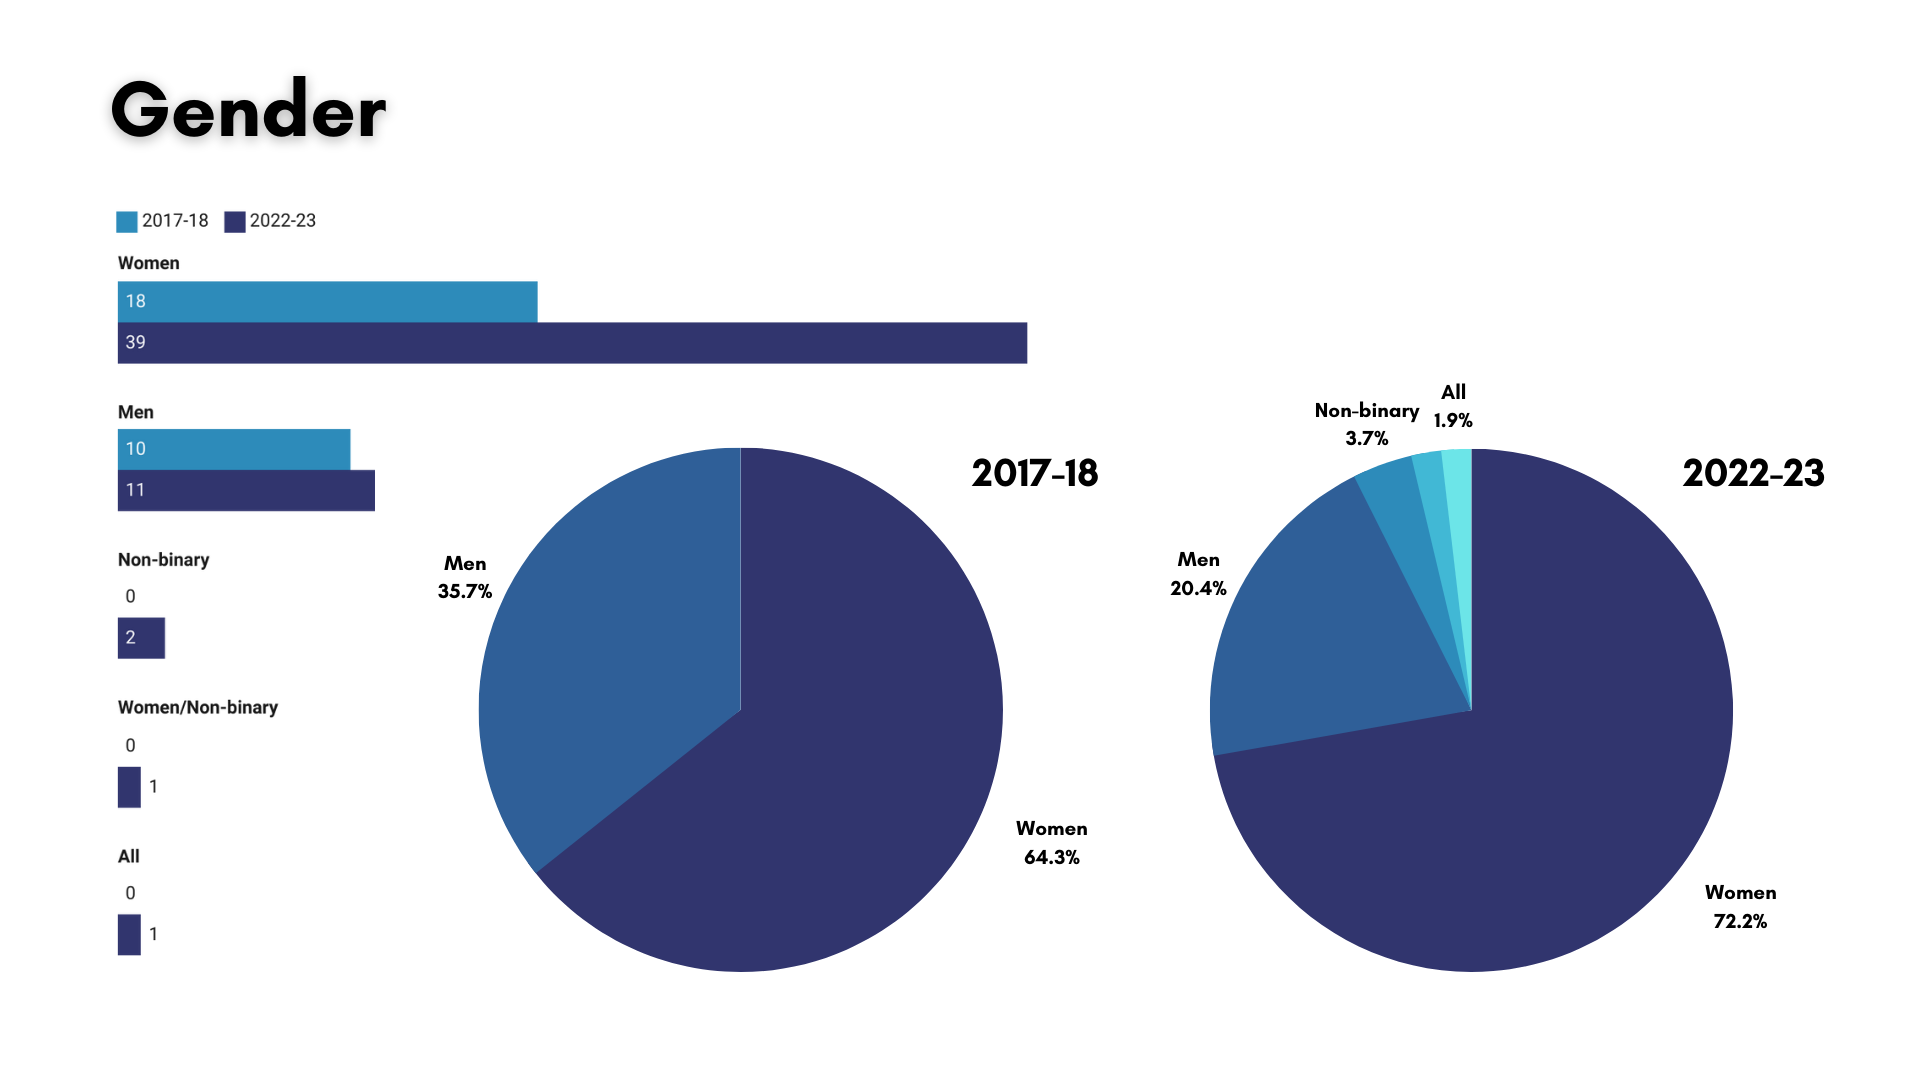
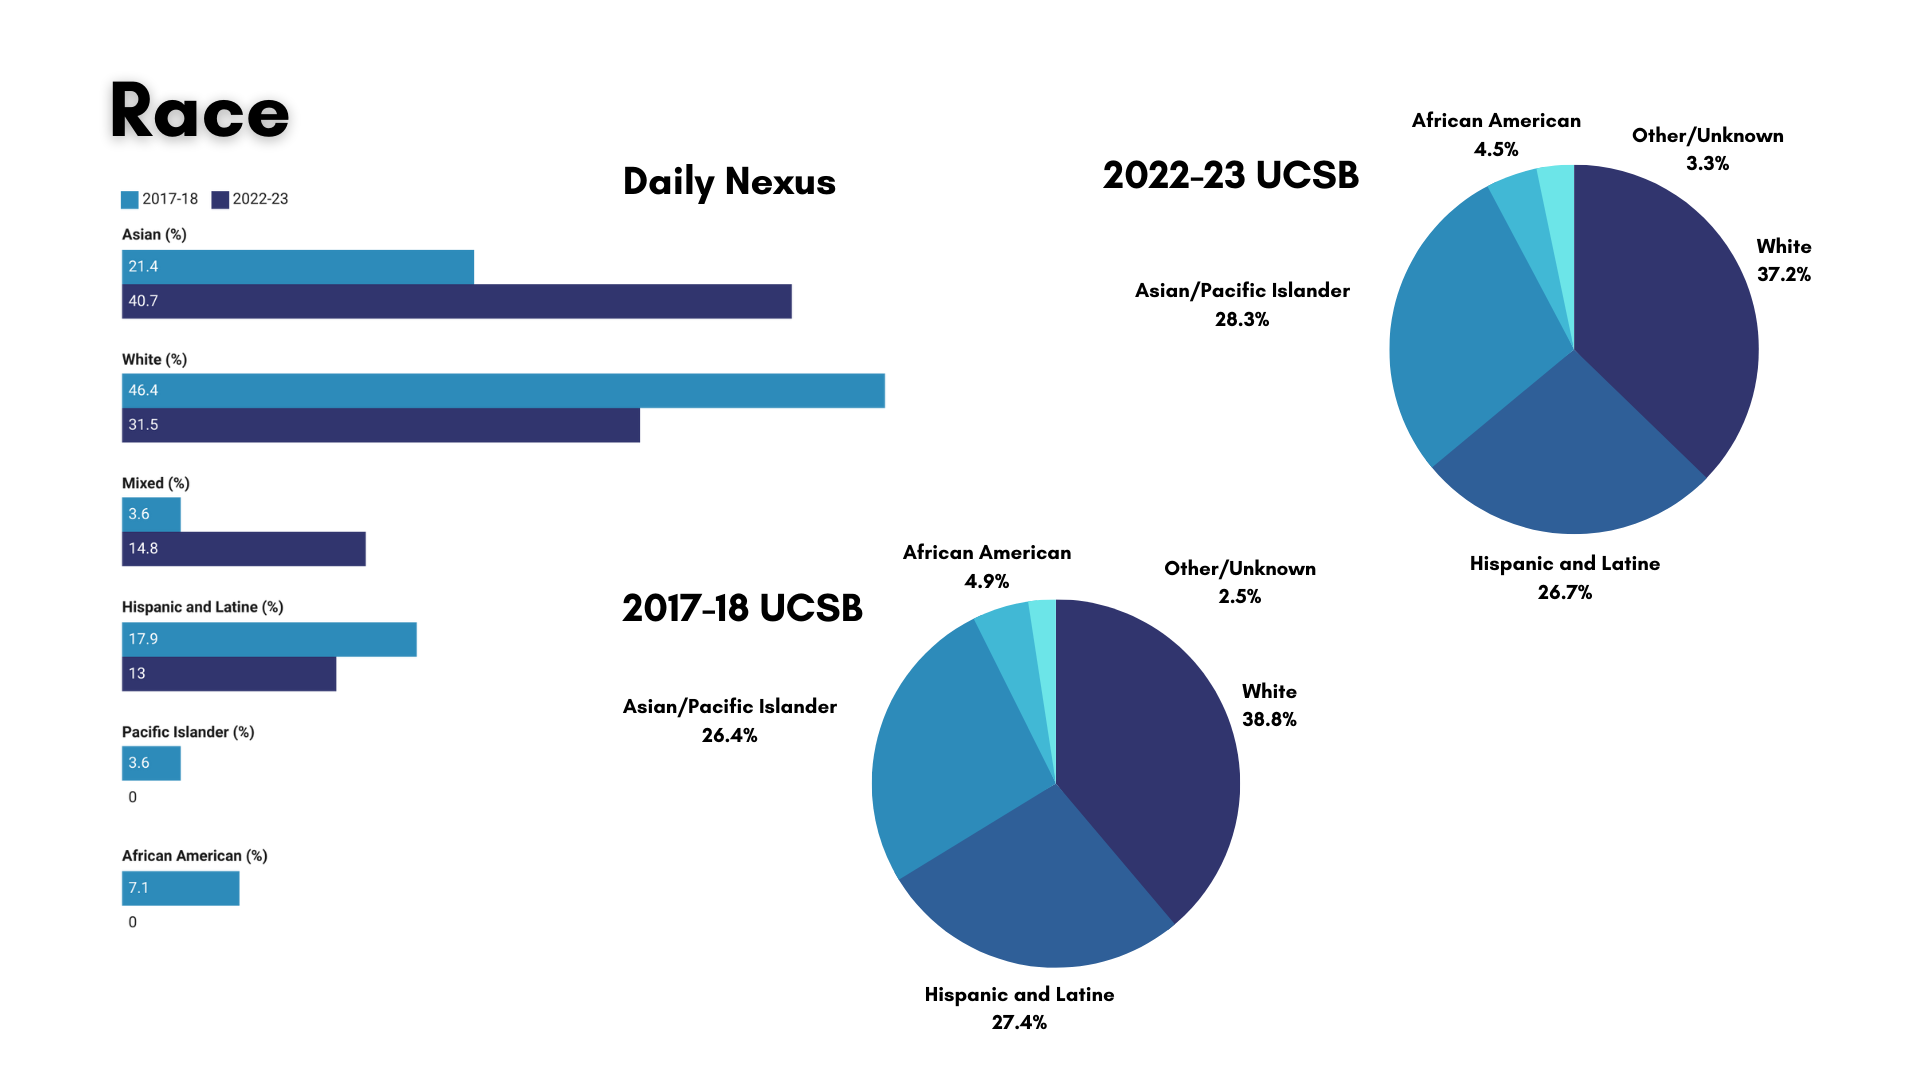
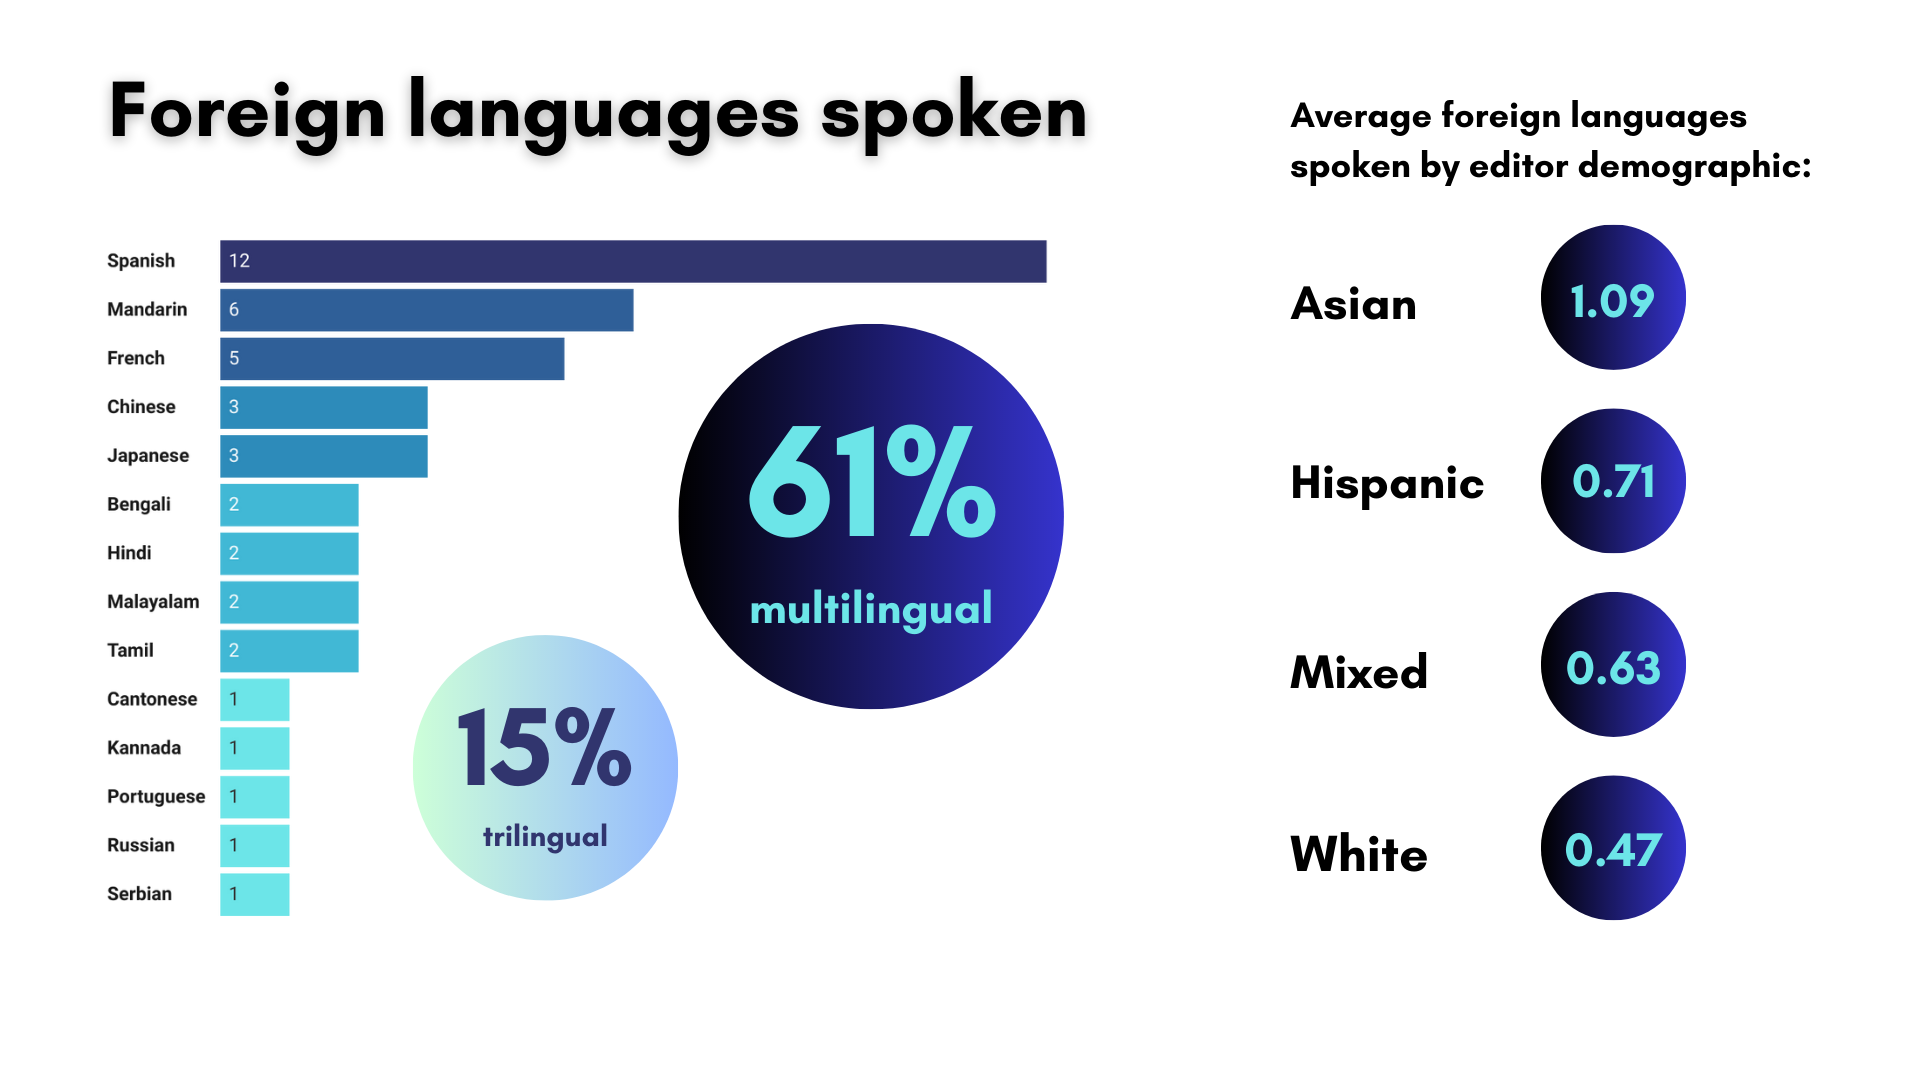
Nexus D.E.I. Report
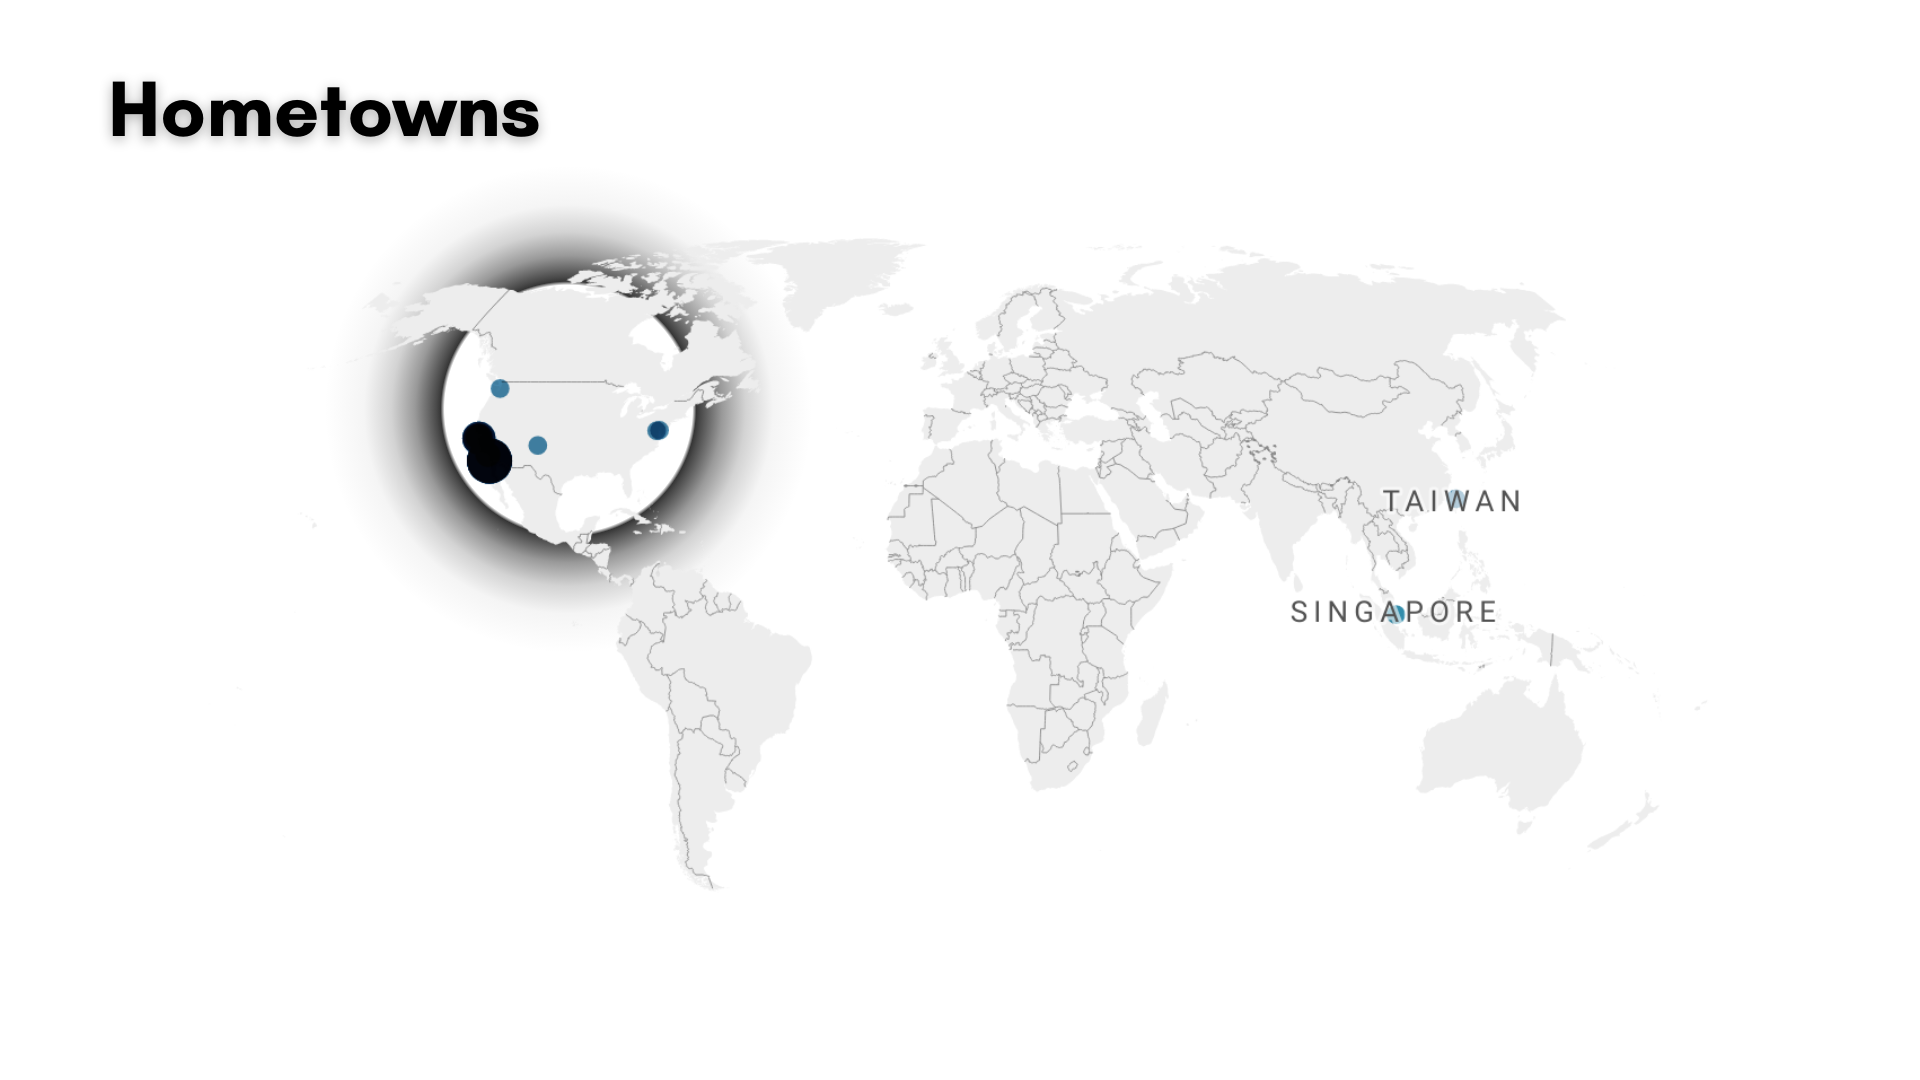
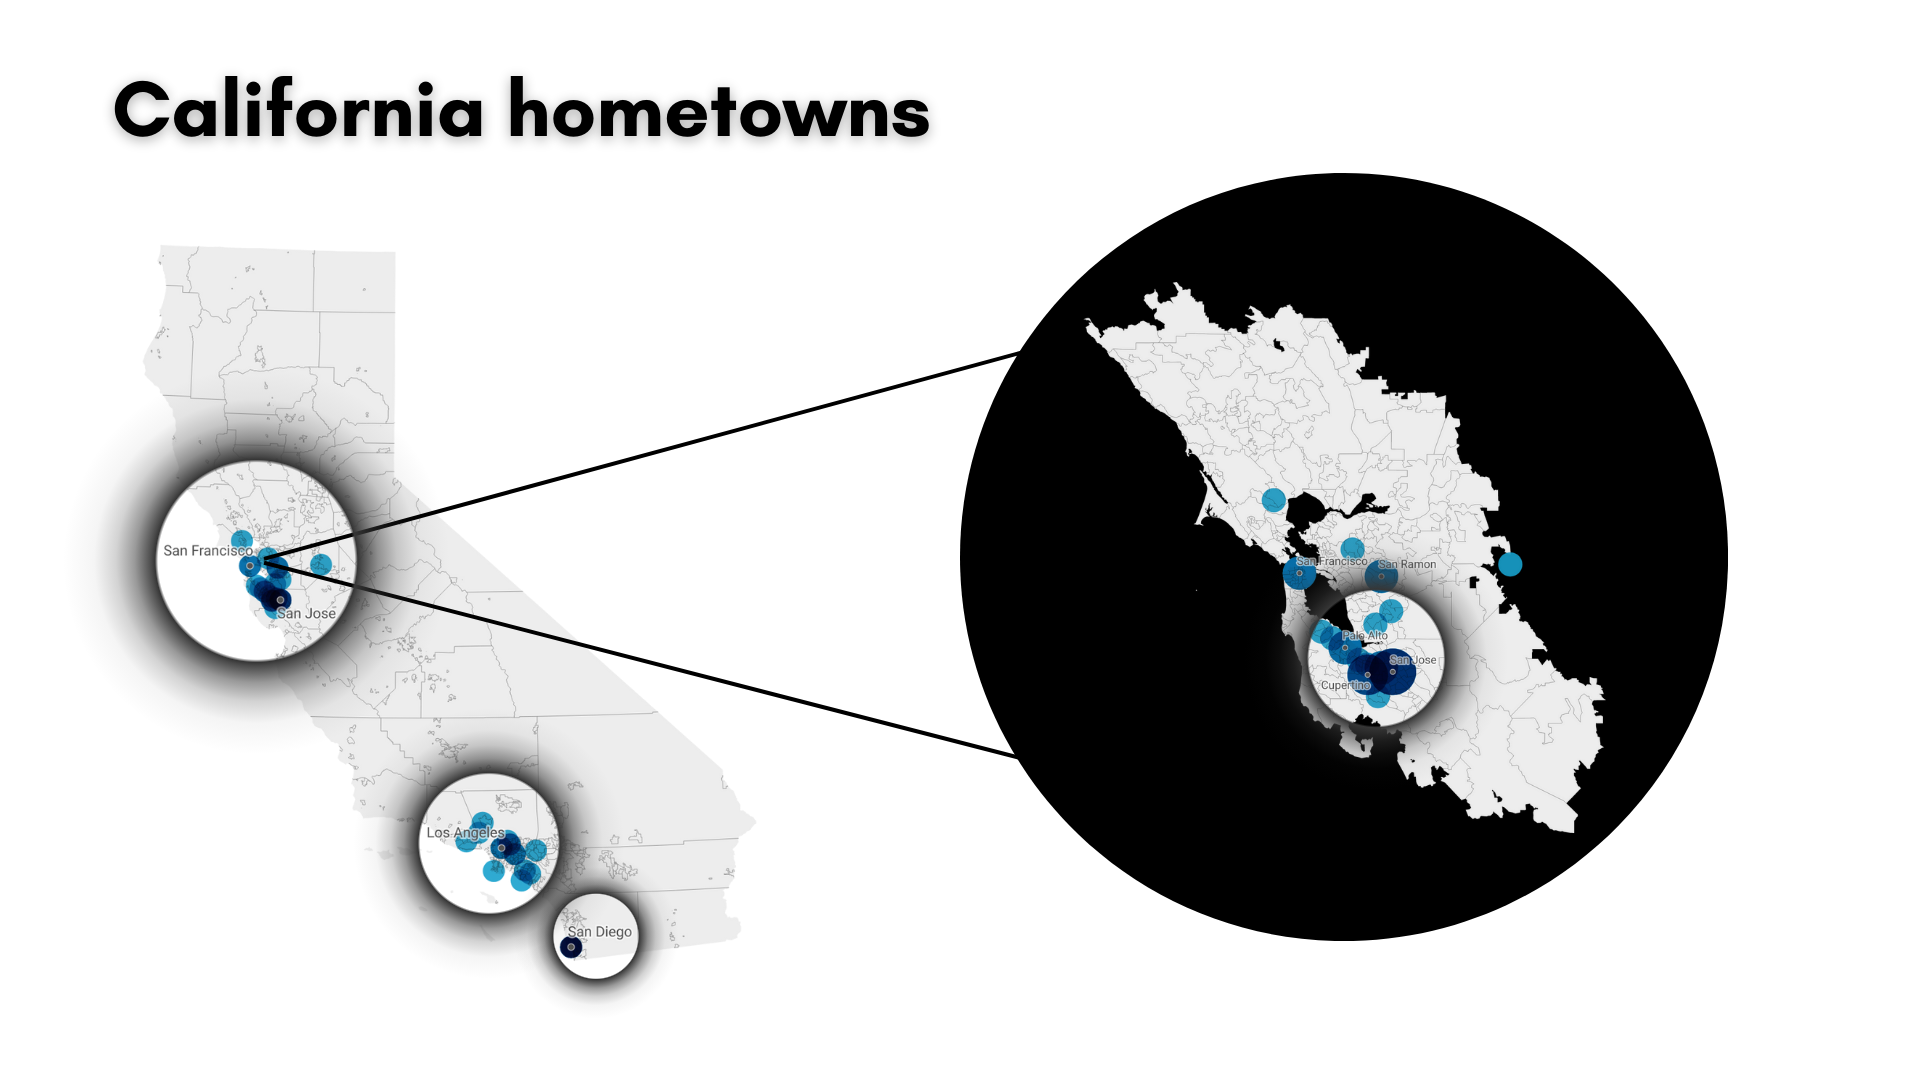
I designed and conducted a survey of the demographics of all Daily Nexus editors. I analyzed the data using Python Pandas and Excel, and I created a report visualizing and analyzing the data. I designed the charts with Datawrapper and Canva, and I custom-built the webpage layout and theme with HTML/CSS/JavaScript. I co-wrote the analysis with the Editor-in-Chief.
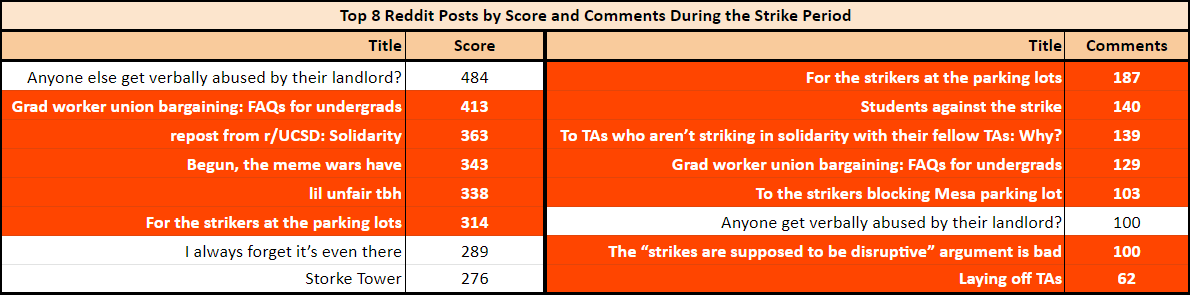
UCSB Strike Sentiment
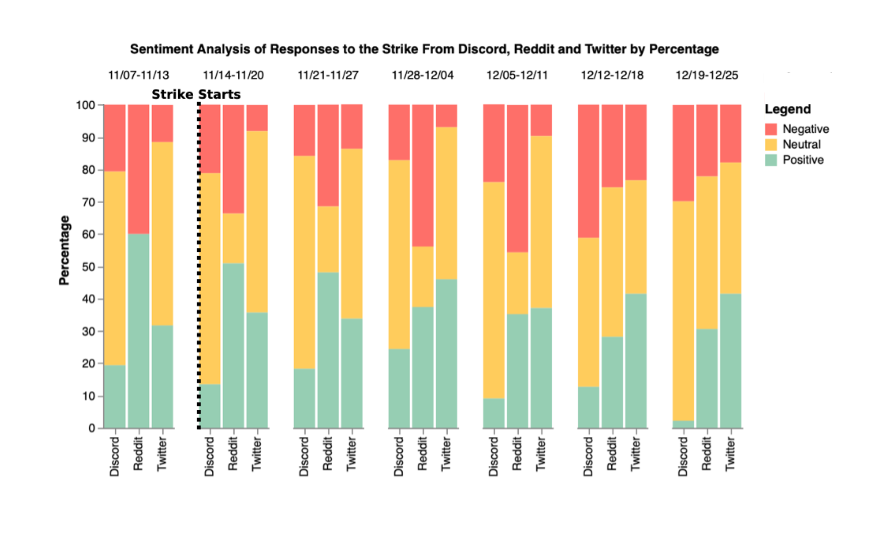
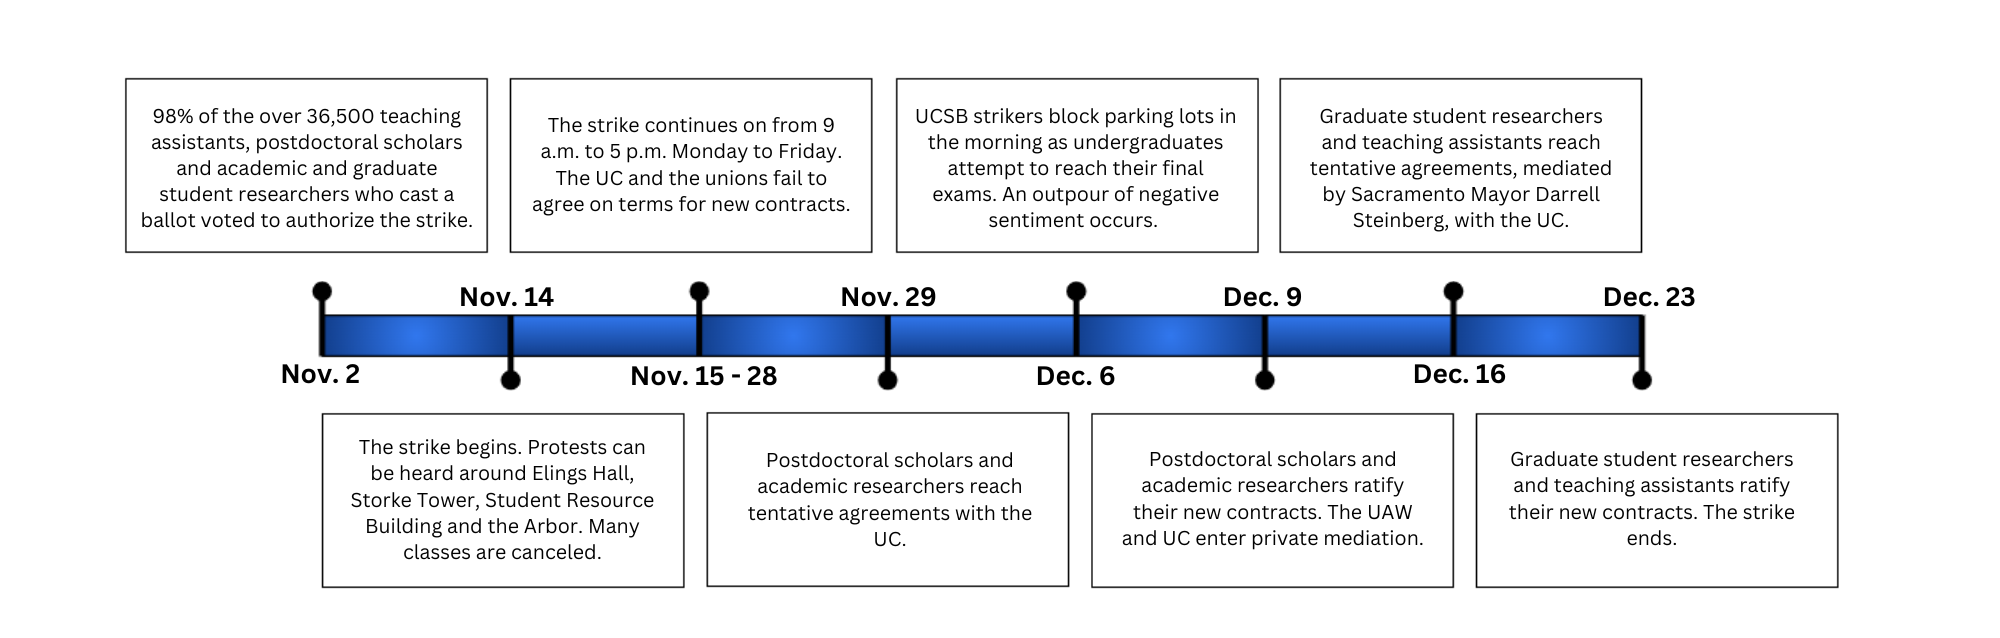
I analyzed the sentiment of social media posts on Twitter and Discord regarding the 2022 UCSB Graduate Student Strike. I used Snscrape to scrape Twitter social media posts and a Discord bot to scrape Discord posts, and I used the NLTK Vader package to analyze the sentiment of the posts. I created multiple visualizations with Matplotlib, Excel, and Canva, I interviewed graduate students to learn the context for the data, and I co-wrote the article.
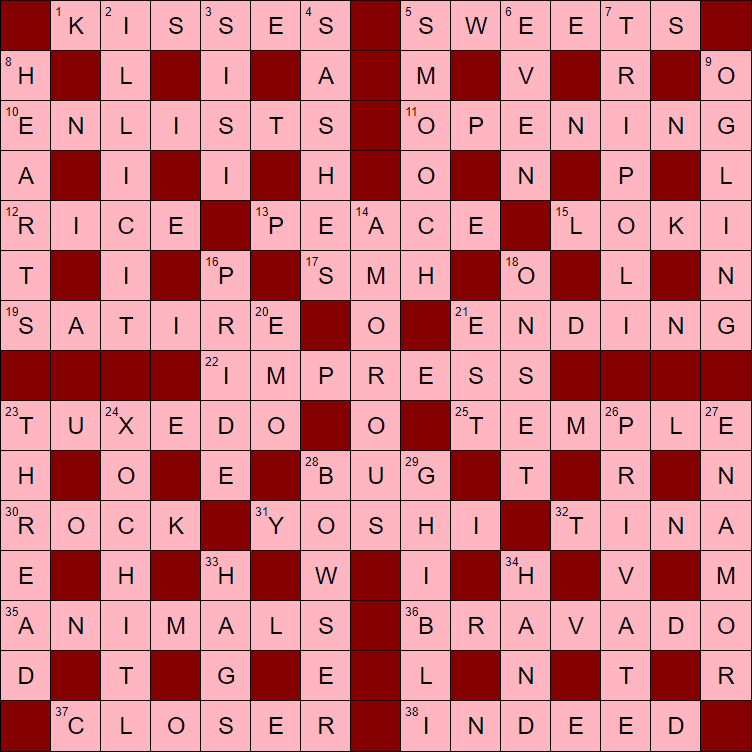
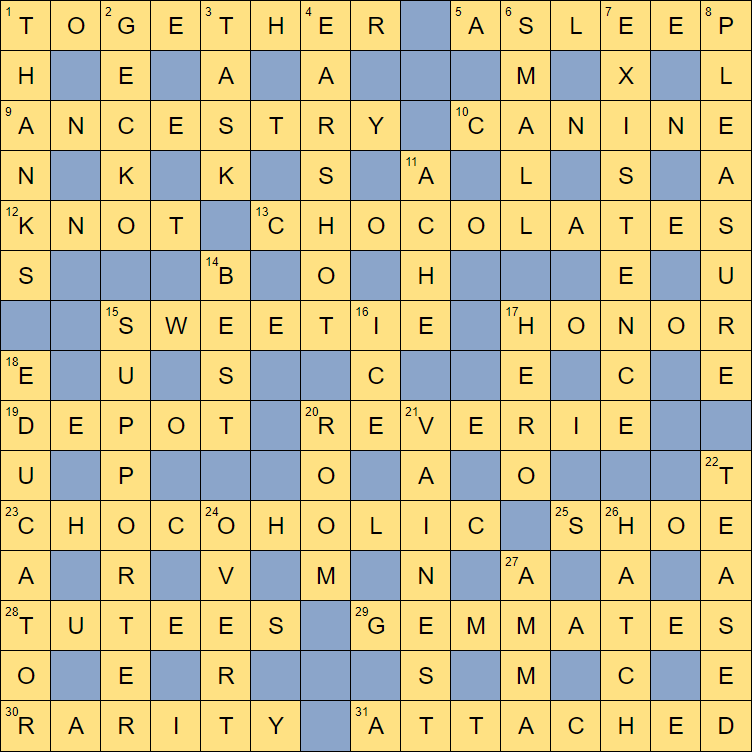
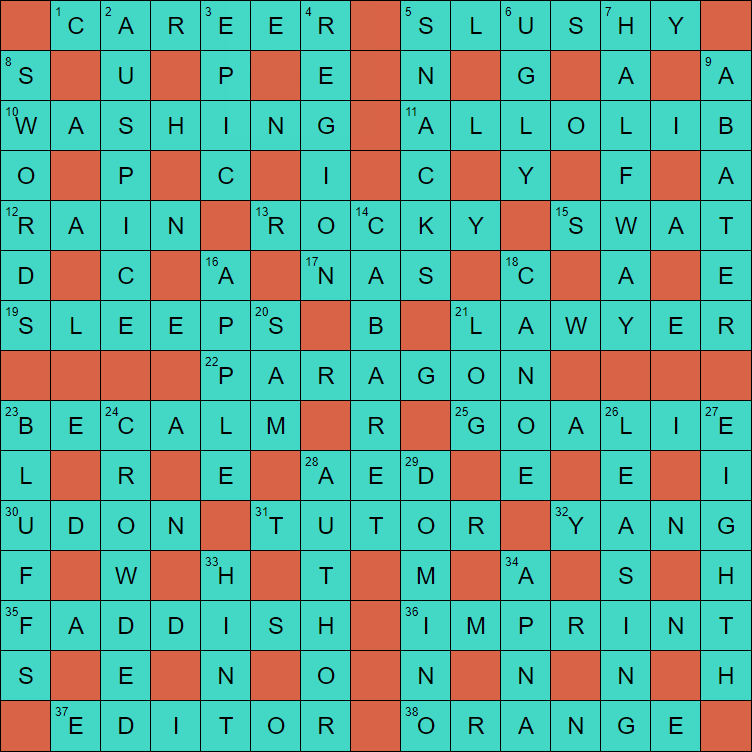
Crossword Puzzles
I create weekly crosswords that are published in the Daily Nexus, UCSB's student newspaper, during each print edition. I design the crosswords, write the clues, and test the puzzles to ensure they are solvable. I also create interactive crossword grids with HTML/CSS/JavaScript and embed the puzzles on the Daily Nexus website. Special edition crosswords are themed.
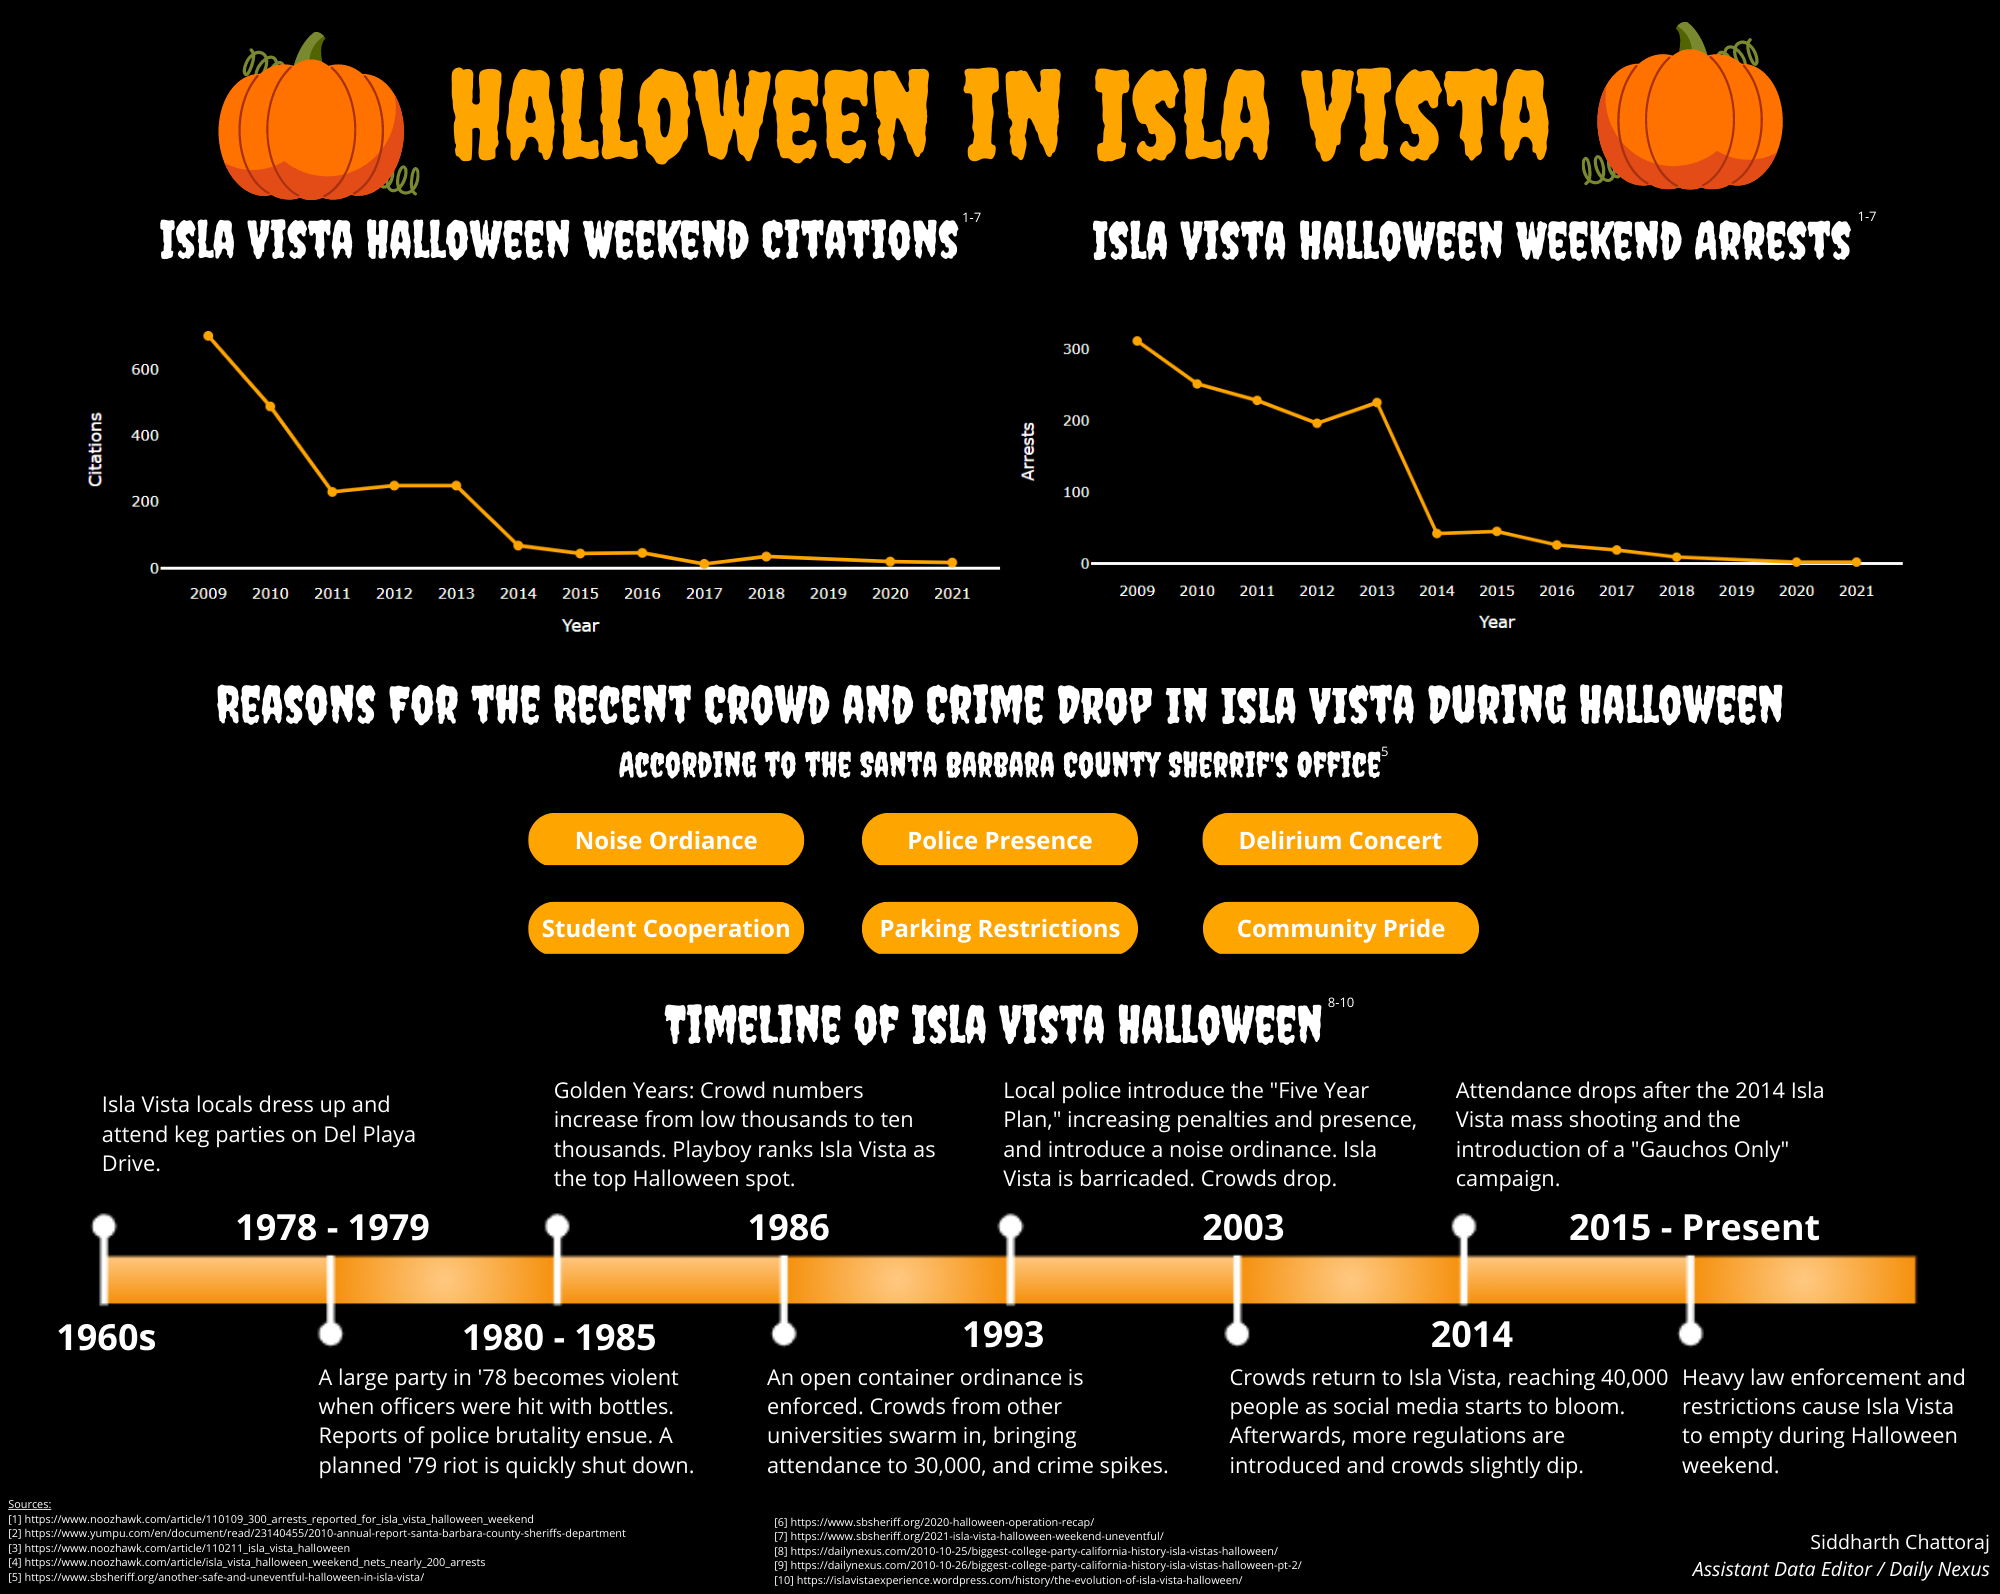
Halloween In Isla Vista
I created an infographic visualizing the history of Halloween in Isla Vista, California, using data from the Santa Barbara County Sheriff's Office. I designed all other aspects of the infographic, including the timeline, in Canva. This infographic won 1st Place for Best Infographic in the state of California at the California College Media Awards.
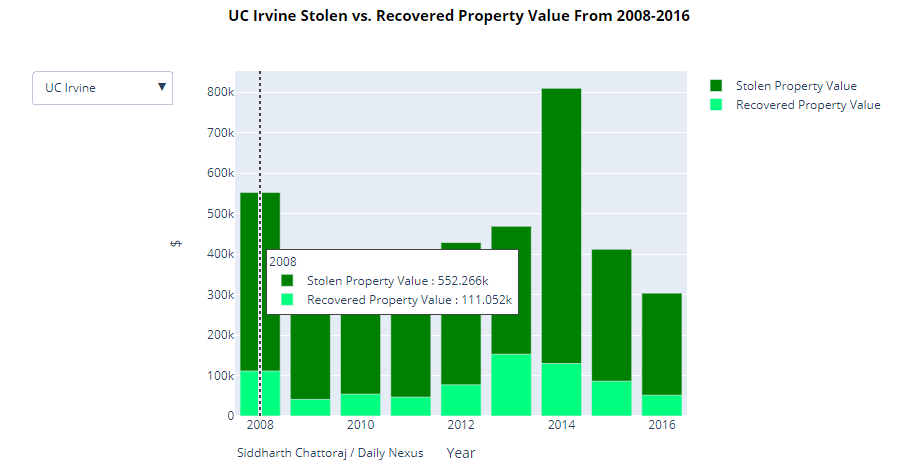
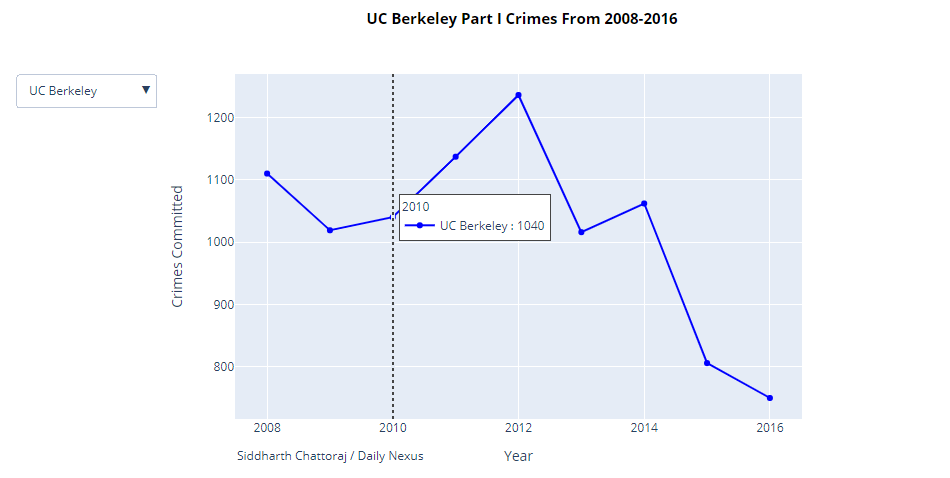
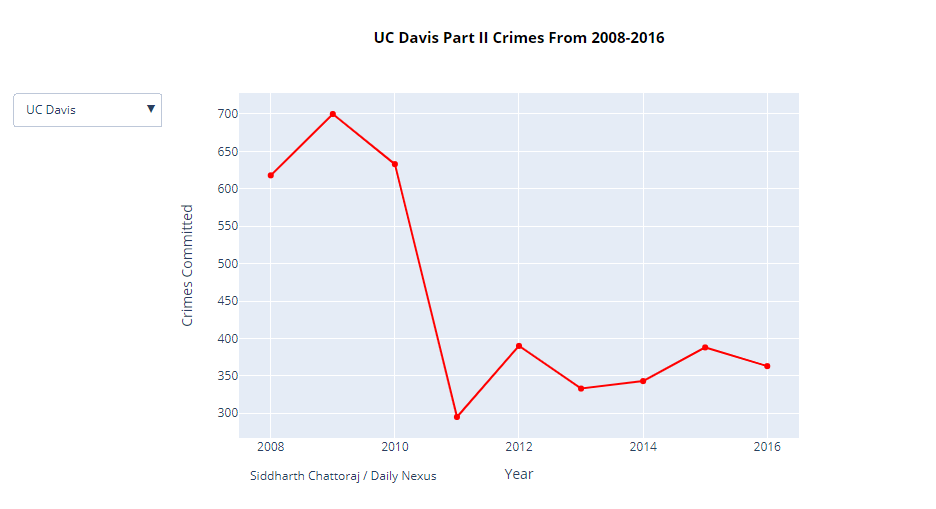
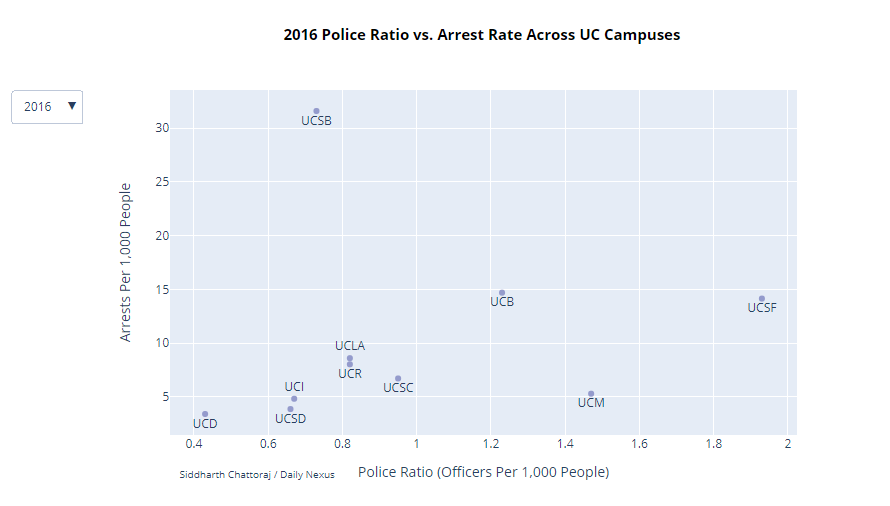
Historical UC Crime Rates
I analyzed crime rate trends from 2008 to 2016 across the University of California system. I used Pandas and Excel to clean the data, and I created multiple interactive dropdown charts with Plotly to visualize the extensive crime data. I also interviewed sources, including the UCSB Police Department Public Information Officer, to understand the context behind crime rates, and I co-wrote the article.