p5.chart.js
Interactive, mobile-responsive data visualization library for p5.js
Creator and Developer
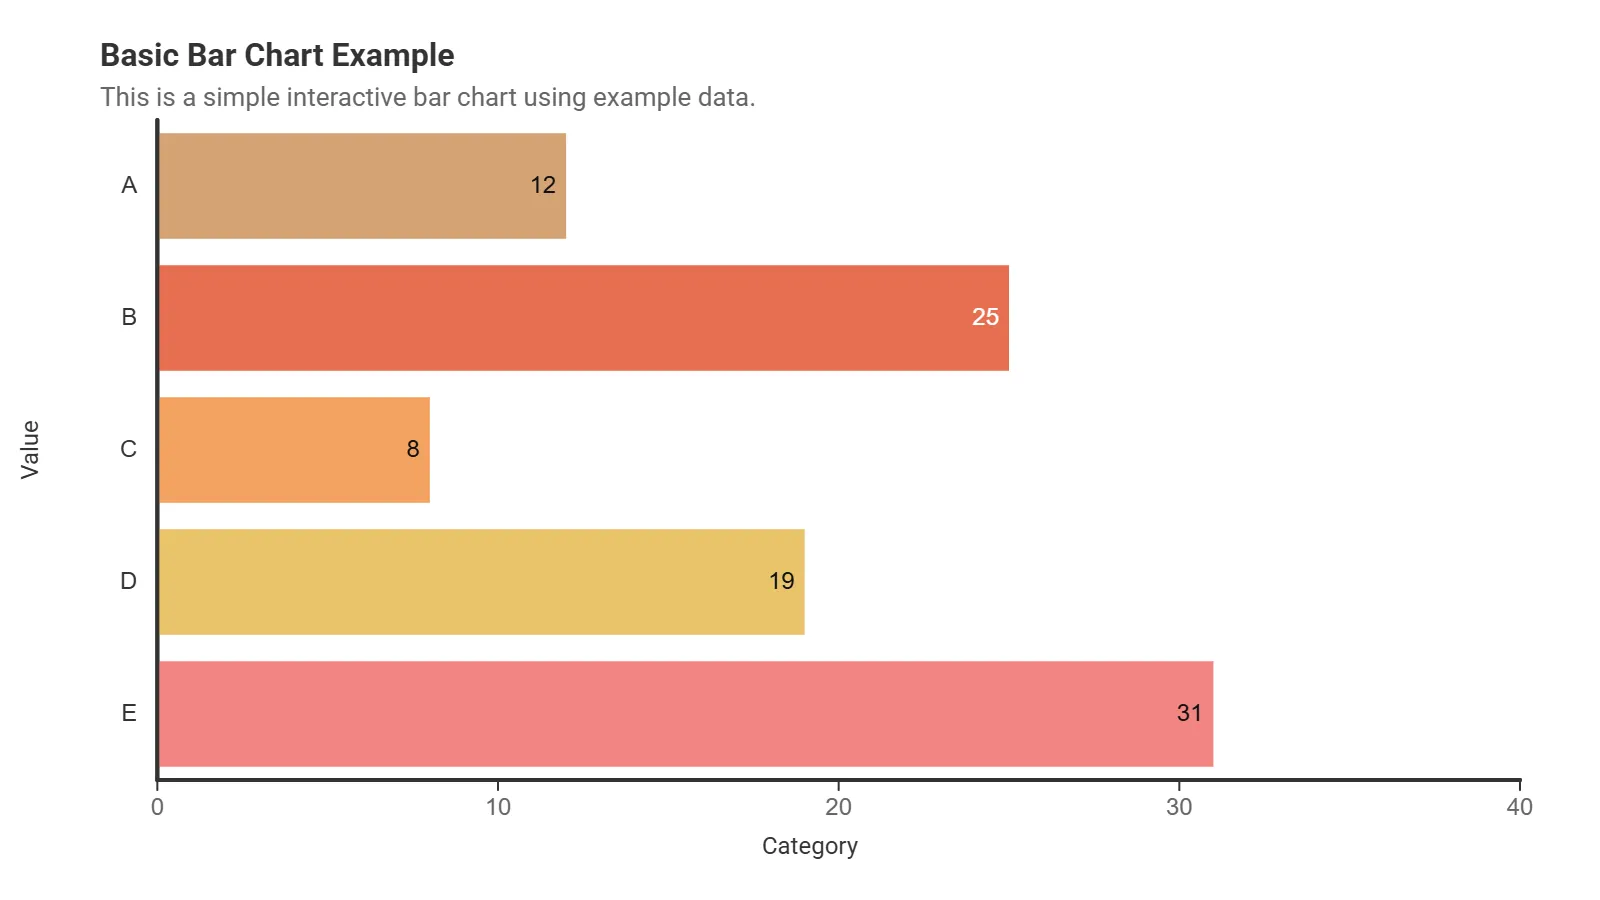
Example Basic Bar Chart
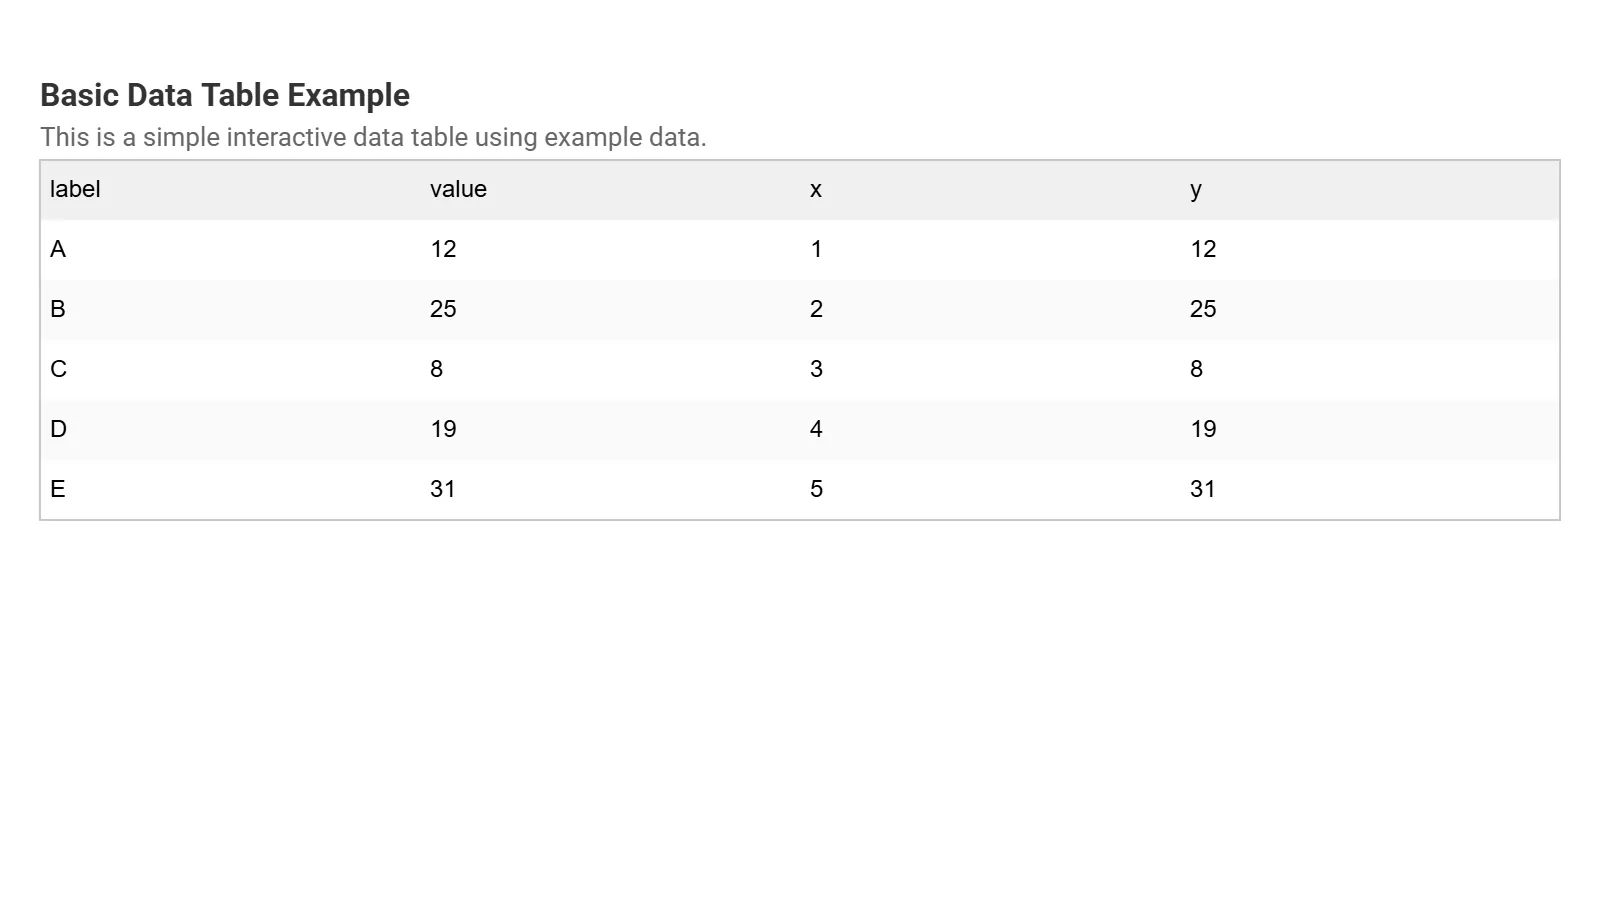
Example Basic Table Chart
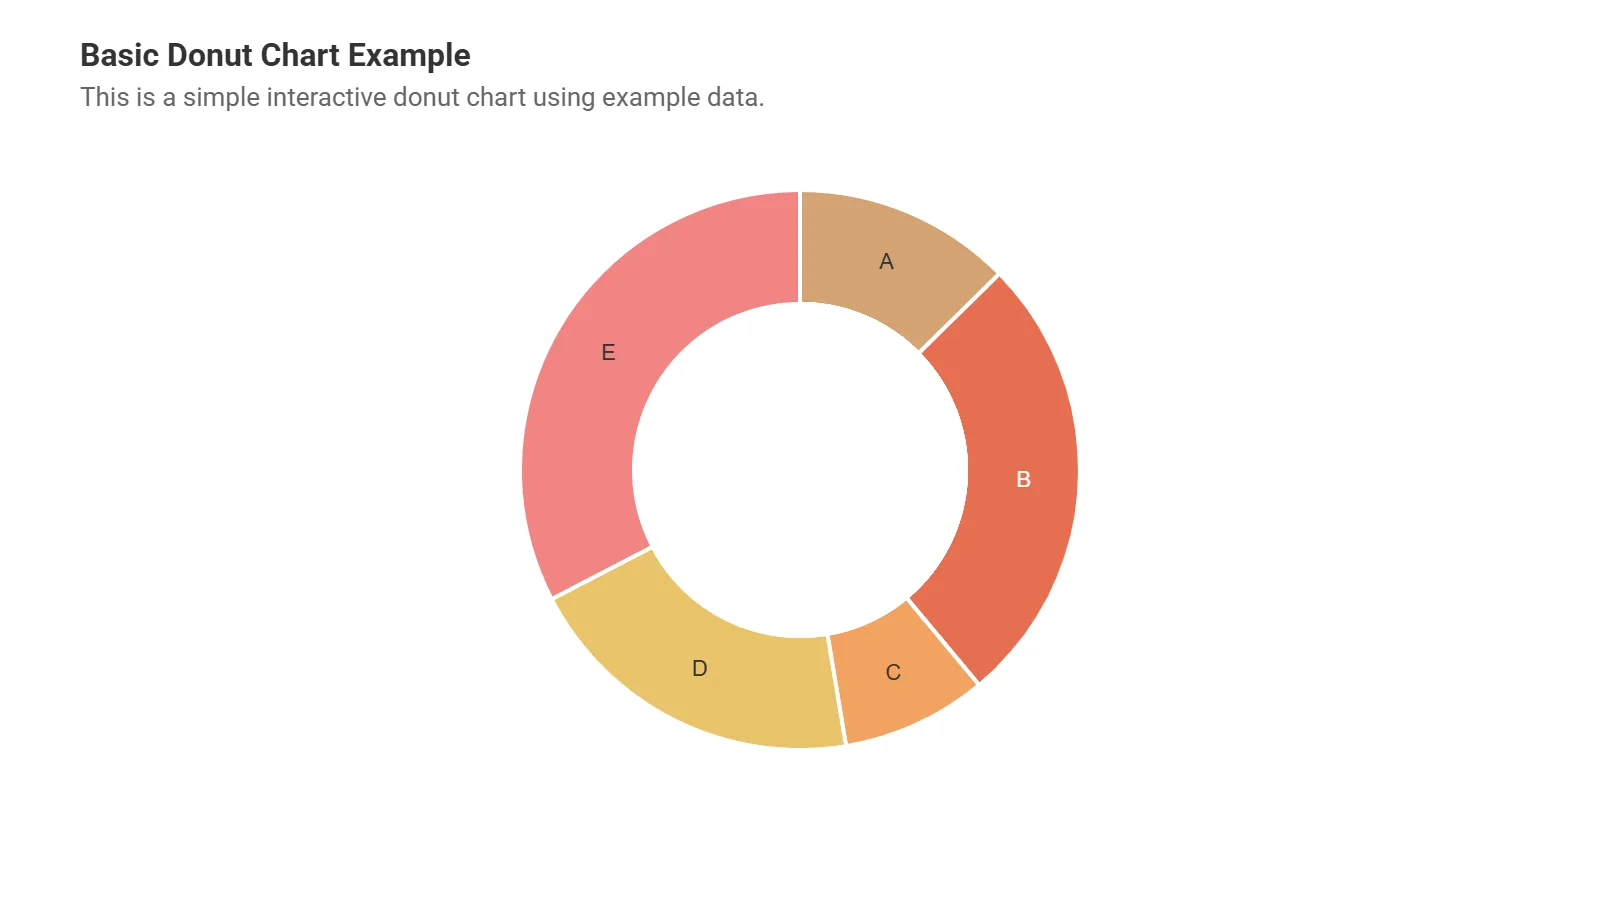
Example Basic Donut Chart
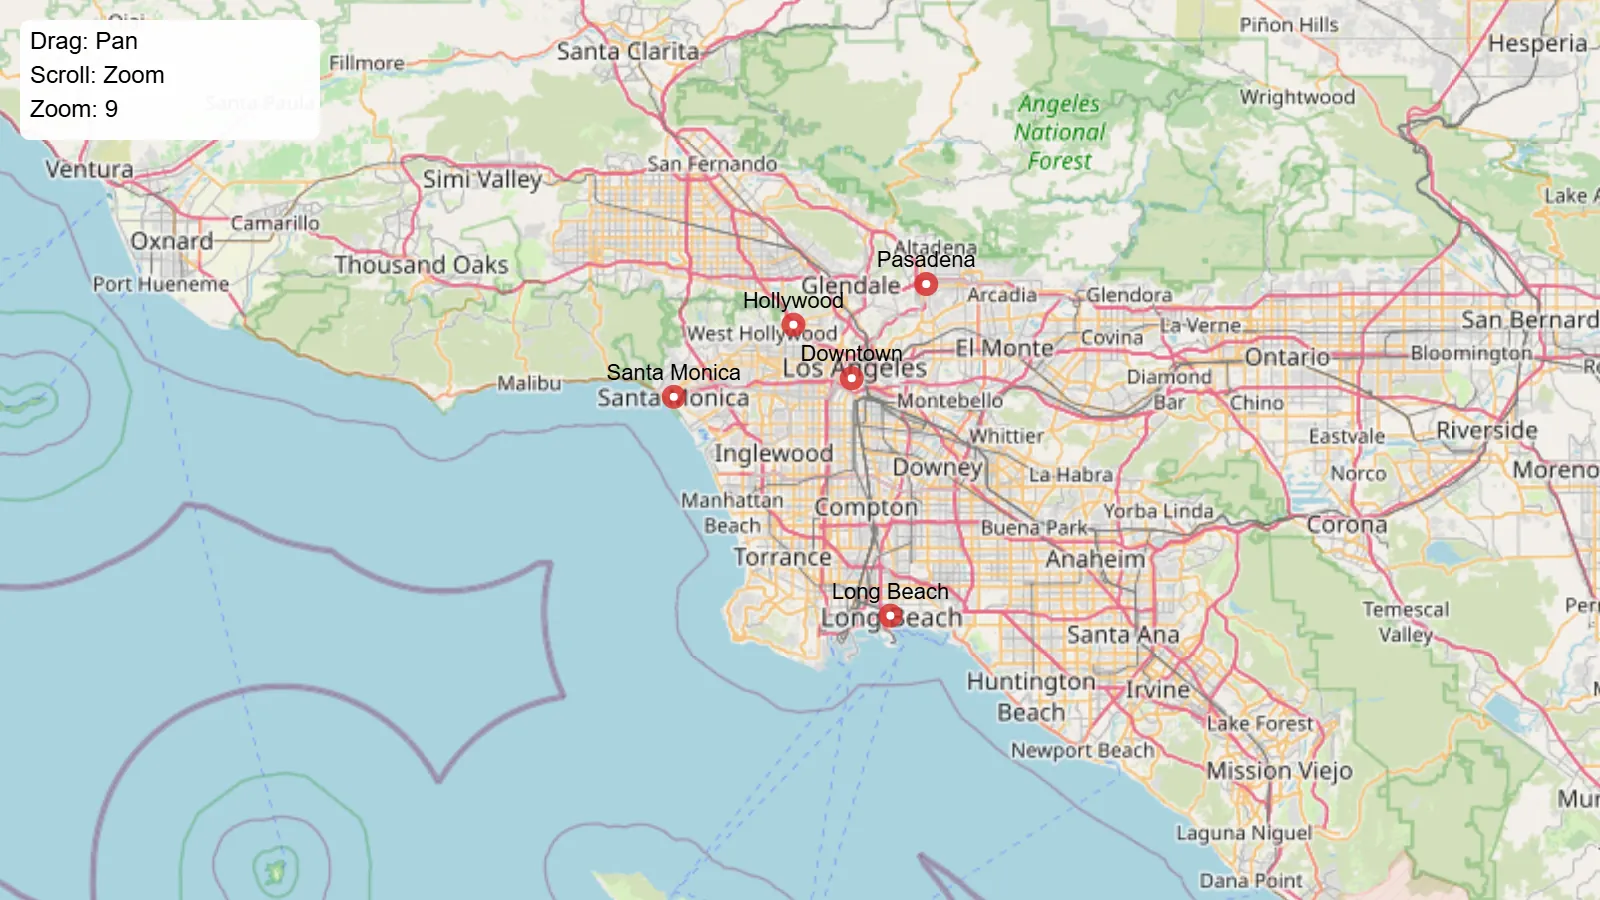
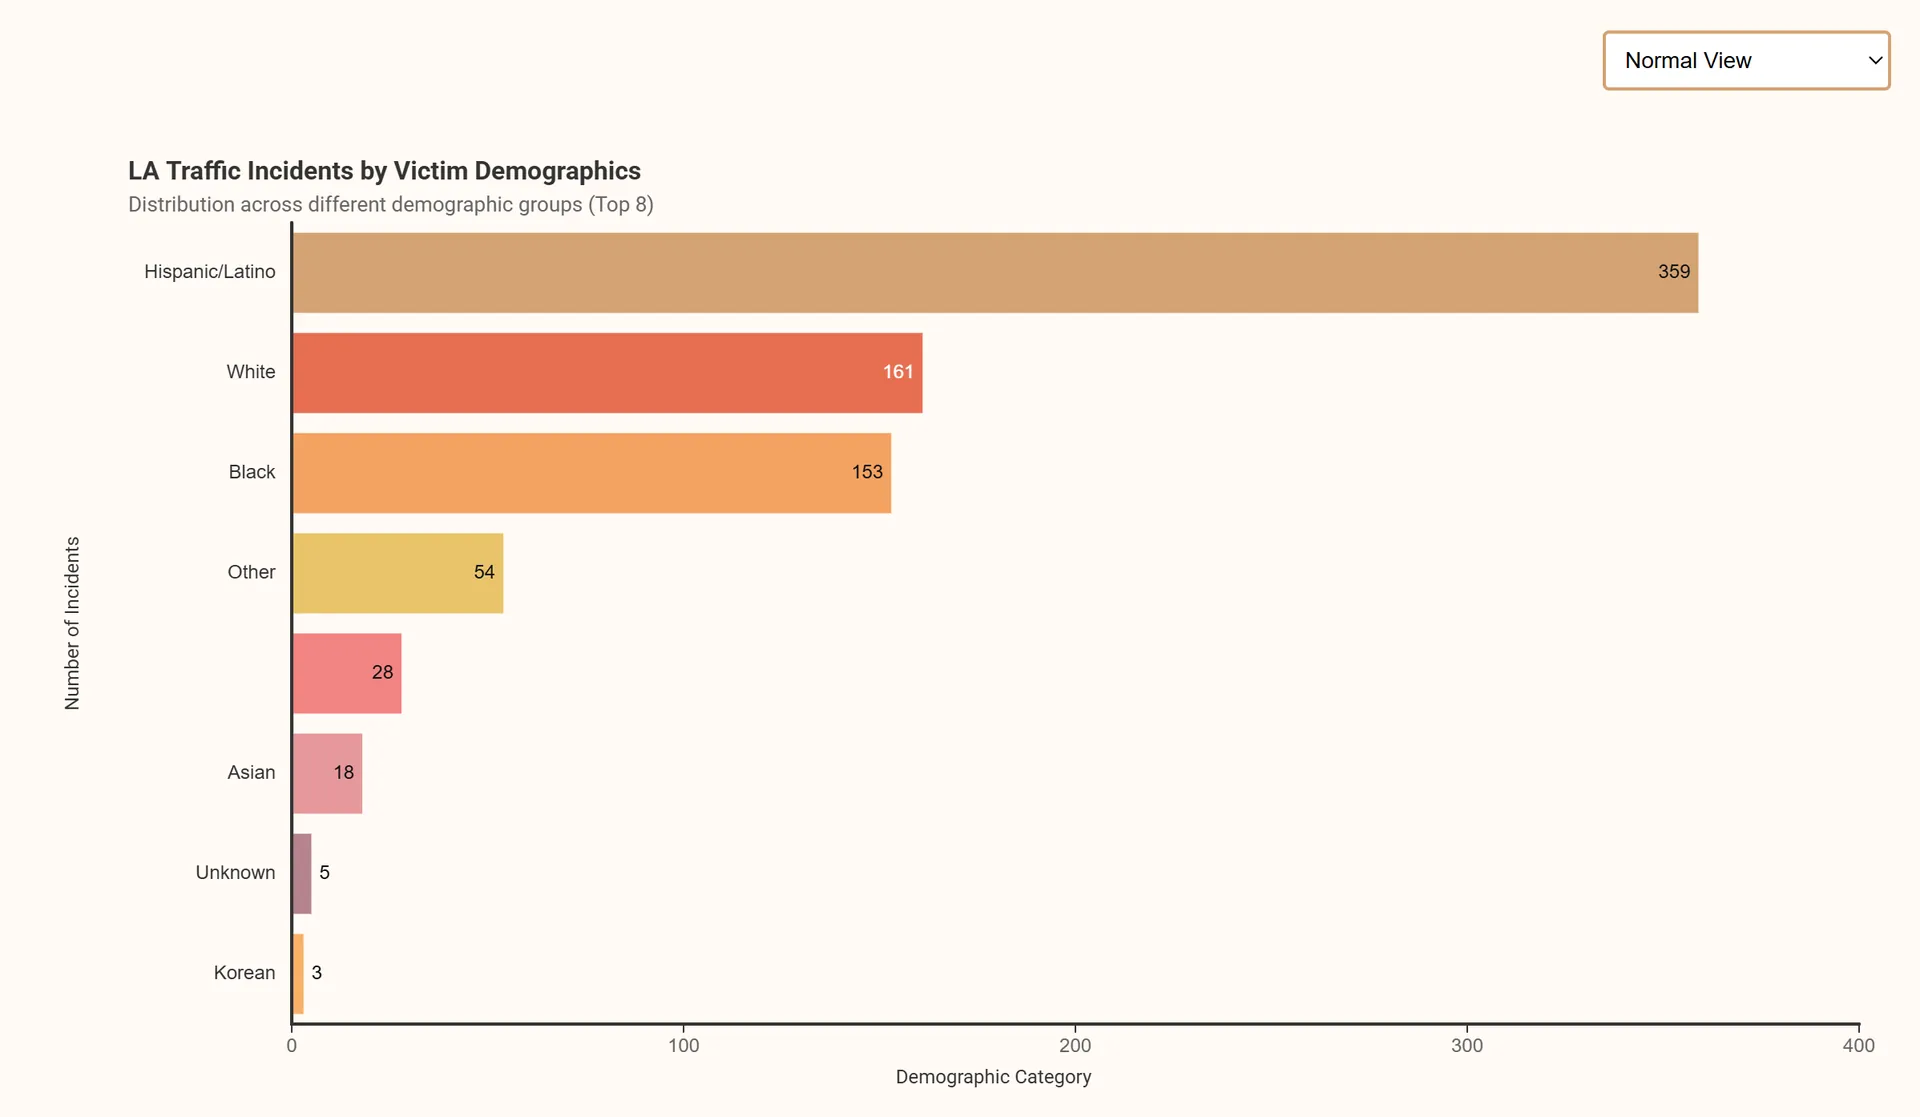
Example Basic Geo Map
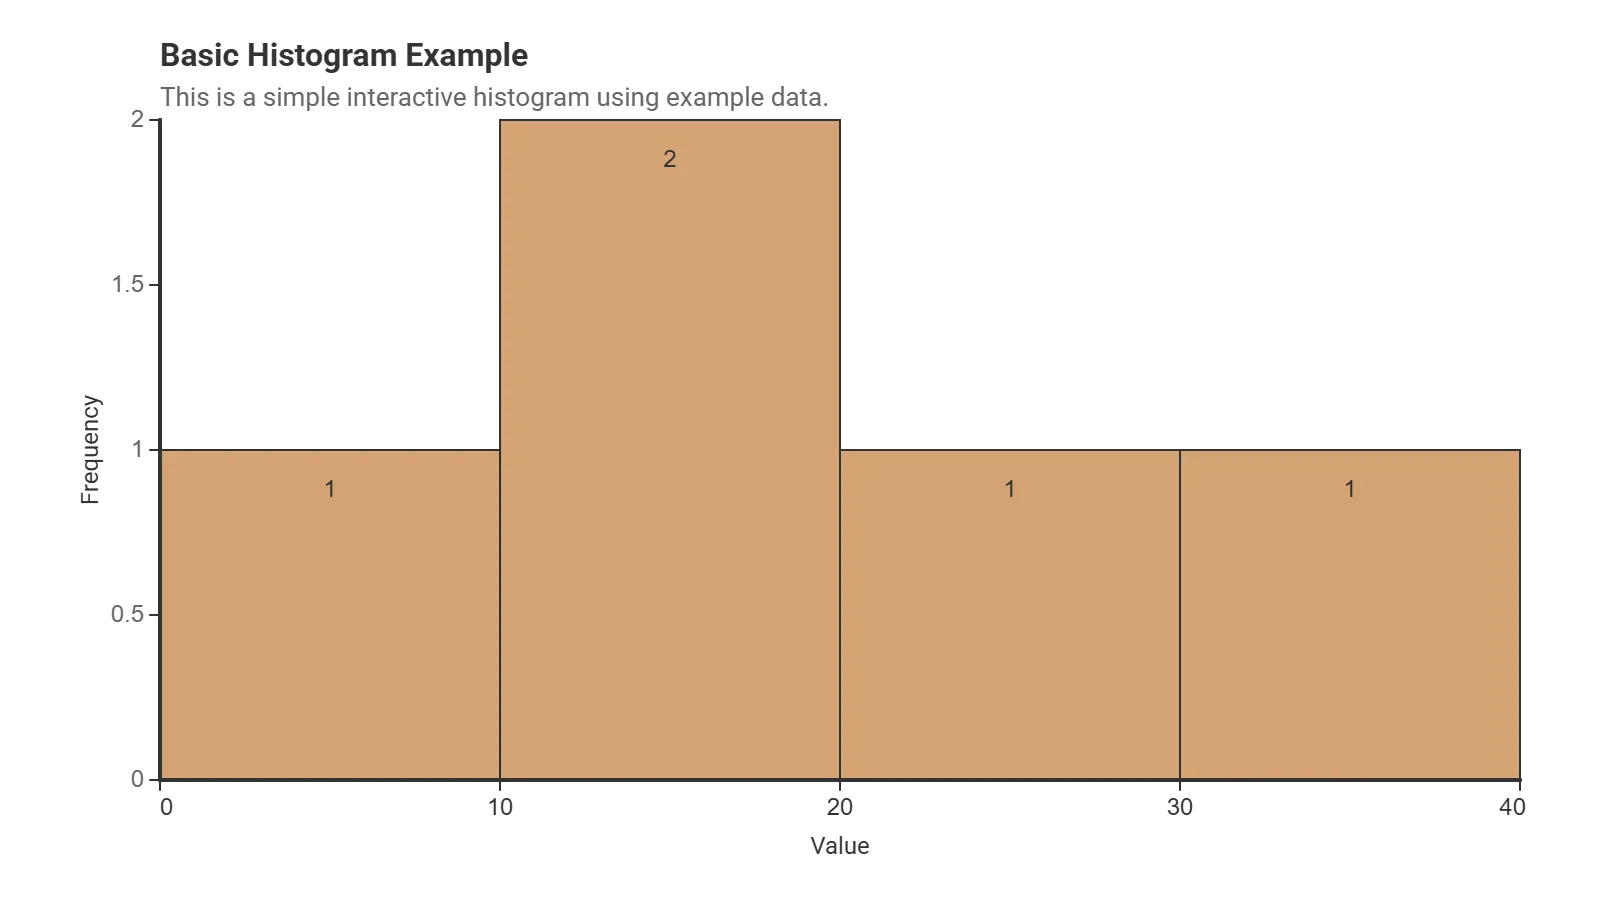
Example Basic Histogram
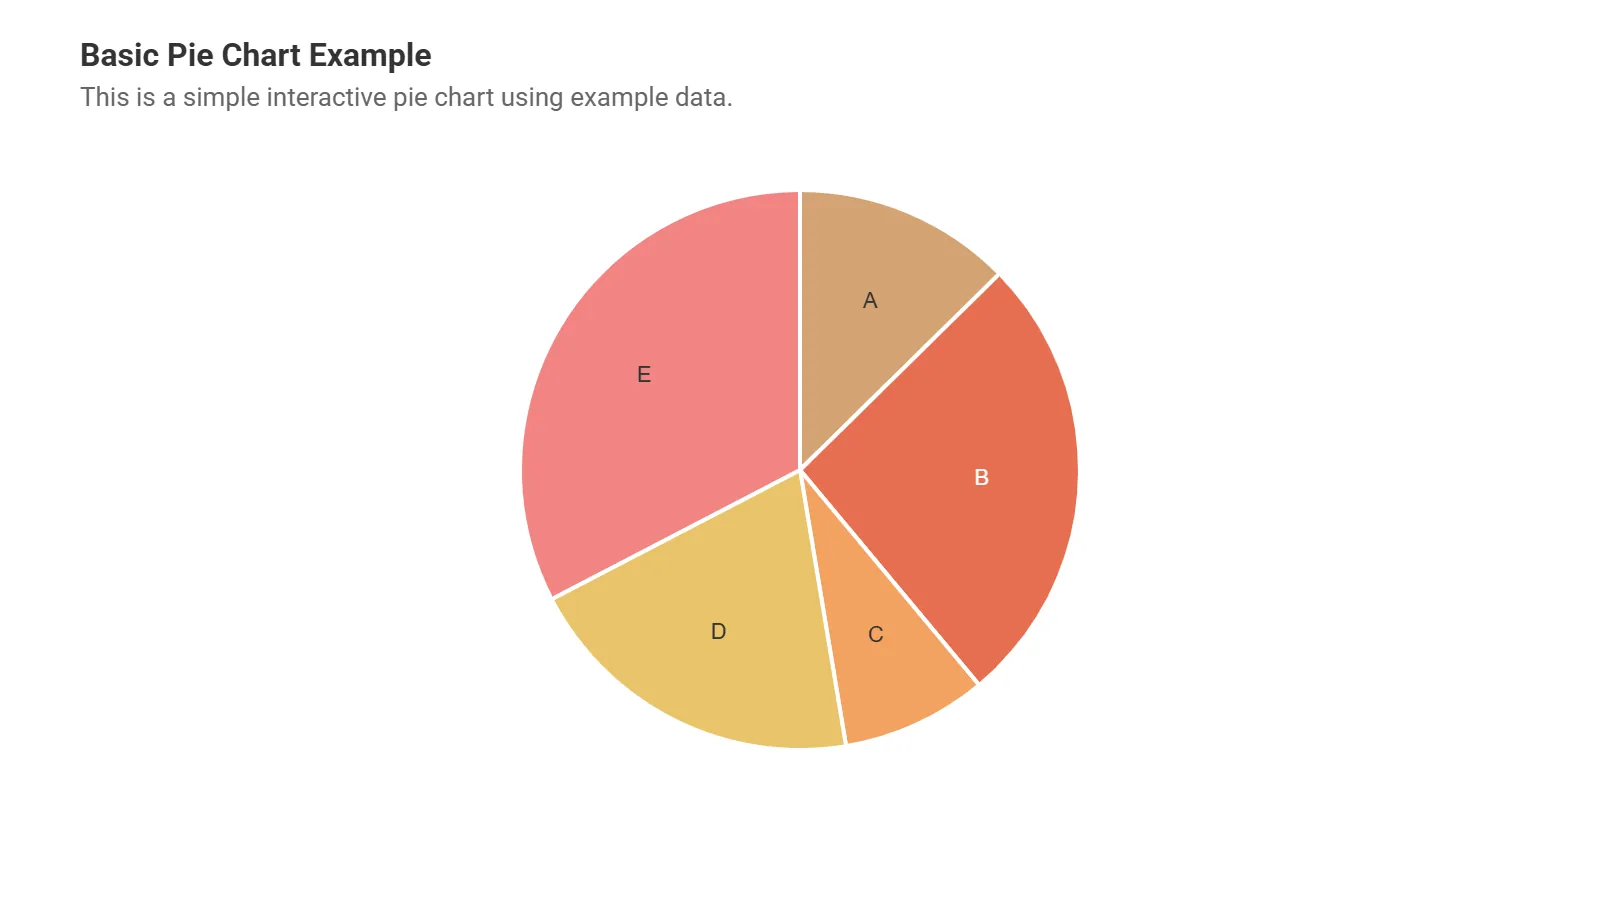
Example Basic Pie Chart

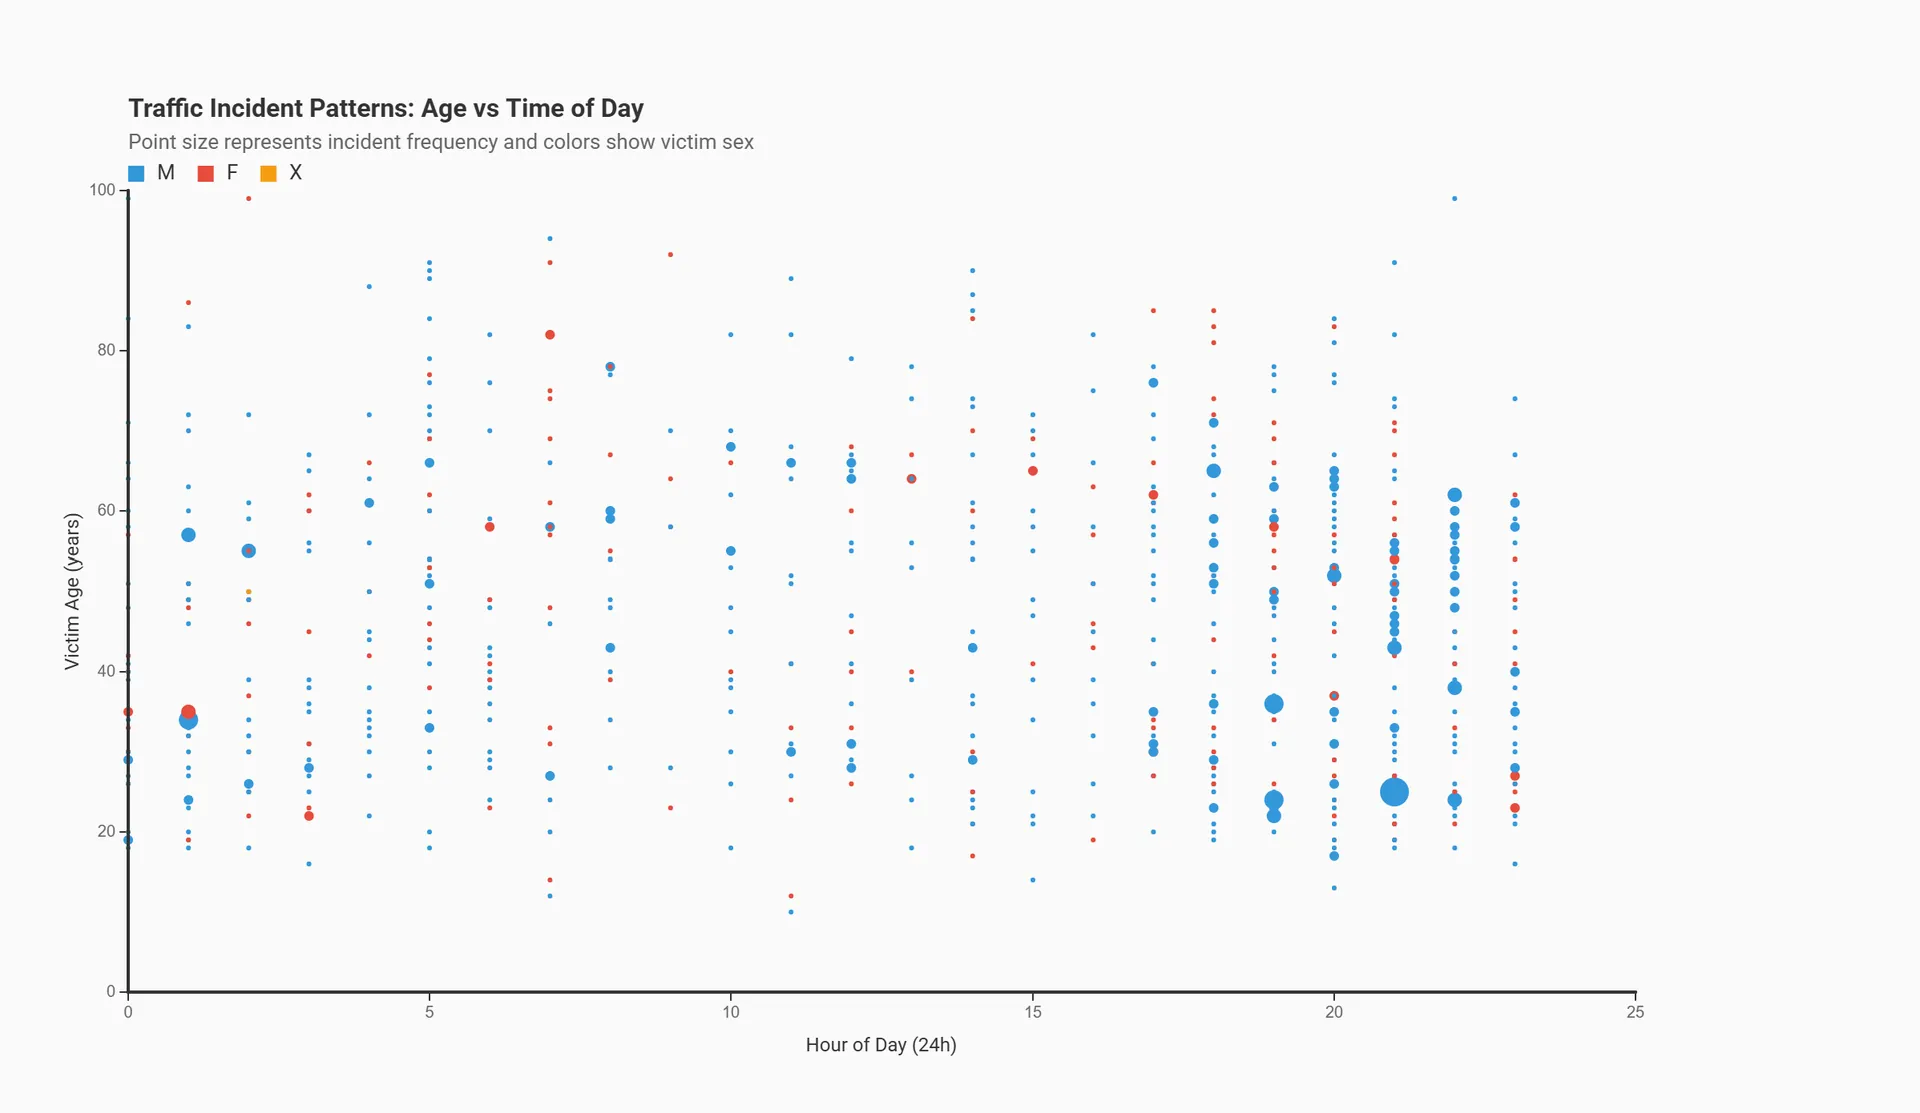
Example Basic Scatterplot
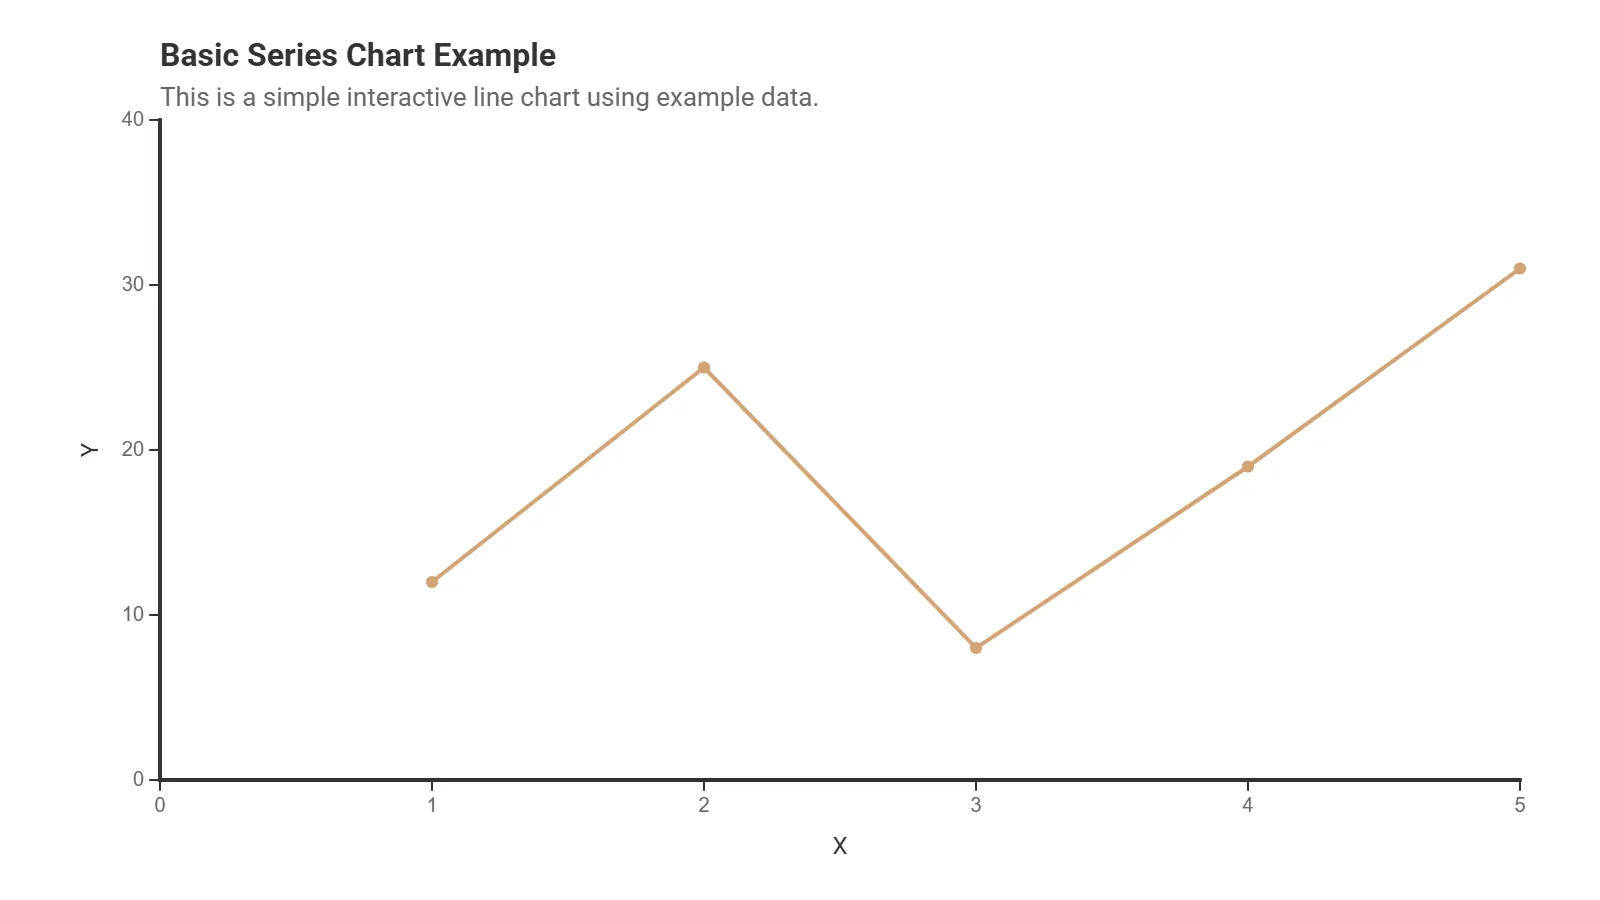
Example Basic Series Chart
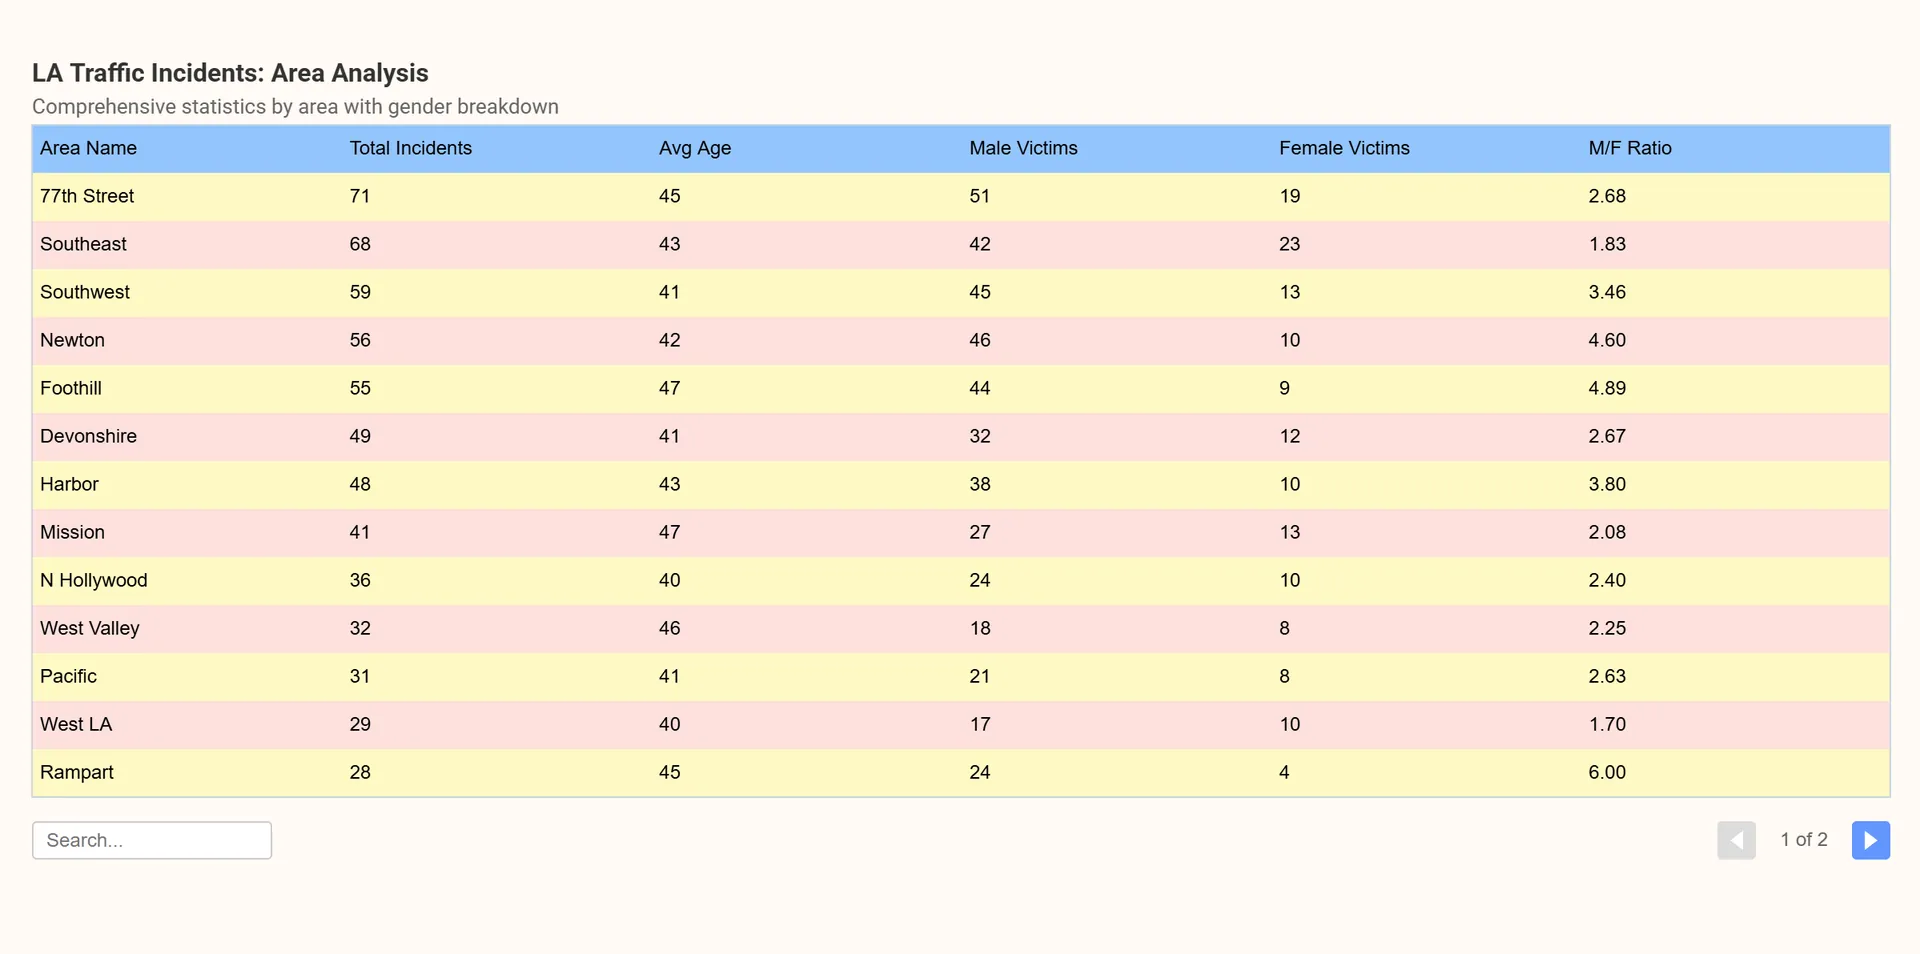
Example Slightly Advanced Table Chart
Example Slightly Advanced Dropdown Bar Chart

Example Slightly Advanced Multi-Series Chart
Example Slightly Advanced Scatterplot
My goal with creating p5.chart.js was to build an interactive data visualization library that lowers the technical barrier to developing visuals with JavaScript for coders unfamiliar with the language and simultaneously supports deeper customization and control, since many modern chart-creation tools either lack flexibility or require substantial scaffolding to produce even simple charts.
The final library extends
Available charts include bar charts, table charts, pie charts (with donut chart option), geo map, histogram, scatter plot, and series (line) charts. DataFrame creation and manipulation is also available.
To install the library, run
The final library extends
p5.prototype with an immediate mode rendering system, utilizing a DataFrame structure that holds data points as an array of objects. Chart methods map values to pixel coordinates on every frame, handling interaction through continuous hit-testing and managing tooltip overlays with a post-render hook. Users can create, import, and/or analyze datasets to generate diverse, interactive visualizations from methods that offer options for efficient creation and deep customizability.Available charts include bar charts, table charts, pie charts (with donut chart option), geo map, histogram, scatter plot, and series (line) charts. DataFrame creation and manipulation is also available.
To install the library, run
npm install p5.chart.
Project Credits
- Creator/Developer
- Siddharth Chattoraj